

Fsnau-Post-Gu-2012-Technical-Report
Fsnau-Post-Gu-2012-Technical-Report
Fsnau-Post-Gu-2012-Technical-Report

Create successful ePaper yourself
Turn your PDF publications into a flip-book with our unique Google optimized e-Paper software.
Appendices<br />
100<br />
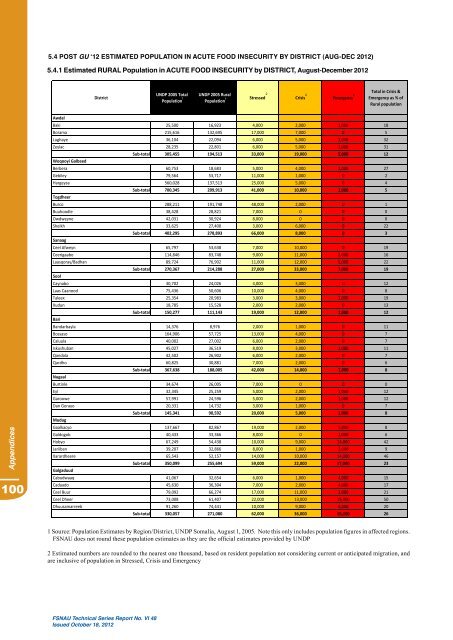
5.4 pOsT GU ‘12 esTiMATed pOpULATiOn in AcUTe FOOd insecURiTY BY disTRicT (AUG-dec <strong>2012</strong>)<br />
5.4.1 estimated RURAL population in AcUTe FOOd insecURiTY by disTRicT, August-december <strong>2012</strong><br />
District<br />
1 Source: Population Estimates by Region/District, UNDP Somalia, August 1, 2005. Note this only includes population figures in affected regions.<br />
FSNAU does not round these population estimates as they are the official estimates provided by UNDP<br />
2 Estimated numbers are rounded to the nearest one thousand, based on resident population not considering current or anticipated migration, and<br />
are inclusive of population in Stressed, Crisis and Emergency<br />
FSNAU <strong>Technical</strong> Series <strong>Report</strong> No. VI 48<br />
Issued October 18, <strong>2012</strong><br />
UNDP 2005 Total<br />
1<br />
1<br />
Population<br />
UNDP 2005 Rural<br />
1<br />
Population<br />
2 2 2<br />
Stressed Crisis Emergency<br />
Total in Crisis &<br />
Emergency as % of<br />
Rural population<br />
Awdal<br />
Baki 25,500 16,923 4,000 2,000 1,000 18<br />
Borama 215,616 132,695 17,000 7,000 0 5<br />
Lughaye 36,104 22,094 6,000 5,000 2,000 32<br />
Zeylac 28,235 22,801 6,000 5,000 2,000 31<br />
Sub‐total 305,455 194,513 33,000 19,000 5,000 12<br />
Woqooyi Galbeed<br />
Berbera 60,753 18,683 5,000 4,000 1,000 27<br />
Gebiley 79,564 53,717 11,000 1,000 0 2<br />
Hargeysa 560,028 137,513 25,000 5,000 0 4<br />
Sub‐total 700,345 209,913 41,000 10,000 1,000 5<br />
Togdheer<br />
Burco 288,211 191,748 48,000 2,000 0 1<br />
Buuhoodle 38,428 28,821 7,000 0 0 0<br />
Owdweyne 42,031 30,924 8,000 0 0 0<br />
Sheikh 33,625 27,400 3,000 6,000 0 22<br />
Sub‐total 402,295 278,893 66,000 8,000 0 3<br />
Sanaag<br />
Ceel Afweyn 65,797 53,638 7,000 10,000 0 19<br />
Ceerigaabo 114,846 83,748 9,000 11,000 2,000 16<br />
Laasqoray/Badhan 89,724 76,902 11,000 12,000 5,000 22<br />
Sub‐total 270,367 214,288 27,000 33,000 7,000 19<br />
Sool<br />
Caynabo 30,702 24,026 4,000 3,000 0 12<br />
Laas Caanood 75,436 50,606 10,000 4,000 0 8<br />
Taleex 25,354 20,983 3,000 3,000 1,000 19<br />
Xudun 18,785 15,528 2,000 2,000 0 13<br />
Sub‐total 150,277 111,143 19,000 12,000 1,000 12<br />
Bari<br />
Bandarbayla 14,376 8,976 2,000 1,000 0 11<br />
Bossaso 164,906 57,725 13,000 4,000 0 7<br />
Caluula 40,002 27,002 6,000 2,000 0 7<br />
Iskushuban 45,027 36,519 8,000 3,000 1,000 11<br />
Qandala 42,502 26,902 6,000 2,000 0 7<br />
Qardho 60,825 30,881 7,000 2,000 0 6<br />
Sub‐total 367,638 188,005 42,000 14,000 1,000 8<br />
Nugaal<br />
Burtinle 34,674 26,005 7,000 0 0 0<br />
Eyl 32,345 25,259 5,000 2,000 1,000 12<br />
Garoowe 57,991 24,596 5,000 2,000 1,000 12<br />
Dan Gorayo 20,331 14,732 3,000 1,000 0 7<br />
Sub‐total 145,341 90,592 20,000 5,000 2,000 8<br />
Mudug<br />
Gaalkacyo 137,667 82,867 19,000 2,000 5,000 8<br />
Galdogob 40,433 33,366 8,000 0 2,000 6<br />
Hobyo 67,249 54,438 10,000 9,000 14,000 42<br />
Jariiban 39,207 32,866 8,000 1,000 2,000 9<br />
Xarardheere 65,543 52,157 14,000 10,000 14,000 46<br />
Sub‐total 350,099 255,694 59,000 22,000 37,000 23<br />
Galgaduud<br />
Cabudwaaq 41,067 32,654 6,000 1,000 4,000 15<br />
Cadaado 45,630 36,304 7,000 2,000 4,000 17<br />
Ceel Buur 79,092 66,274 17,000 11,000 3,000 21<br />
Ceel Dheer 73,008 61,407 22,000 13,000 18,000 50<br />
Dhuusamarreeb 91,260 74,441 10,000 9,000 6,000 20<br />
Sub‐total 330,057 271,080 62,000 36,000 35,000 26