

Fsnau-Post-Gu-2012-Technical-Report
Fsnau-Post-Gu-2012-Technical-Report
Fsnau-Post-Gu-2012-Technical-Report

Create successful ePaper yourself
Turn your PDF publications into a flip-book with our unique Google optimized e-Paper software.
Regional Analysis<br />
68<br />
4.3.7 NORThEAST REGIONS<br />
Overview<br />
<strong>Post</strong> <strong>Gu</strong> <strong>2012</strong>, the food security situation improved in most of the rural livelihoods in the<br />
Northeast regions (Hawd, Addun, Nugaal valey, Sool plateau and parts of Dharoor/Karkaar<br />
and East Golis). In July’12, the total rural population in acute food insecurity phases of Crisis<br />
(IPC Phase 3) and Emergency (IPC Phase 4) were estimated at 30,000 people (20,000<br />
in Crisis and 10,000 in Emergency). This indicates an improvement from post-Deyr 2011,<br />
when numbers of affected population (65,000 people) were significantly higher than current<br />
figures. In the post-<strong>Gu</strong> <strong>2012</strong>, only the Coastal Deeh livelihood remains in crisis (upper part<br />
is in Emergency while the lower part improved to Crisis), while all the other livelihoods in<br />
the Northeast are in Stress (IPC phase 2) phase. In urban areas, estimates of population<br />
in crisis in August-December <strong>2012</strong> are equivalent to 105,000 people) indicating an increase<br />
(88%) from July’12 (56,000 people) as a result of an increase<br />
in the cost of living (see urban sector).<br />
The factors that contributed to the improved food security<br />
situation in rural areas include near normal frankincense<br />
production in East Golis (one of the main sources of income);<br />
enhanced livestock production and reproduction; increased<br />
income from livestock sales, particularly during the Ramadan<br />
festivities; strengthened ToT between rice and local goat due<br />
to increased goat prices; declining/ stable rice prices; and<br />
increased humanitarian access. However, the food security<br />
situation of the poor pastoral households in the upper Coastal<br />
Deeh remains unchanged due to the negative impacts of<br />
previous drought incidents that resulted in drastic livestock<br />
asset losses and emergence of pastoral destitutes. As a<br />
consequence, poor households have a limited number of saleable animals and are highly indebted (USD 250-350). A<br />
decline in fishing activities in the Coastal livelihood (Iskushuban, Allula and Qandala districts) was also observed as a result<br />
of limited fishing grounds due to fear of pirates and international anti-piracy forces. Trade with Yemen did resume in April,<br />
however it was interrupted by the monsoon season.<br />
FSNAU <strong>Technical</strong> Series <strong>Report</strong> No. VI 48<br />
Issued October 18, <strong>2012</strong><br />
Northeast Region Livelihood<br />
Systems<br />
Table 28: Northeast, Estimated Rural and Urban Population by District in Emergency and Crisis, Aug-Dec <strong>2012</strong><br />
District<br />
UNDP 2005<br />
Rural/Urban<br />
Population<br />
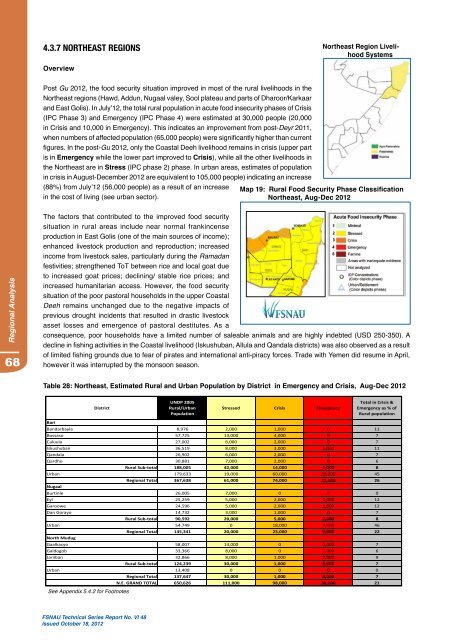
Map 19: Rural Food Security Phase Classification<br />
Northeast, Aug-Dec <strong>2012</strong><br />
Stressed Crisis Emergency<br />
Total in Crisis &<br />
Emergency as % of<br />
Rural population<br />
Bari<br />
Bandarbayla 8,976 2,000 1,000 0 11<br />
Bossaso 57,725 13,000 4,000 0 7<br />
Caluula 27,002 6,000 2,000 0 7<br />
Iskushuban 36,519 8,000 3,000 1,000 11<br />
Qandala 26,902 6,000 2,000 0 7<br />
Qardho 30,881 7,000 2,000 0 6<br />
Rural Sub‐total 188,005 42,000 14,000 1,000 8<br />
Urban 179,633 19,000 60,000 20,000 45<br />
Regional Total 367,638 61,000 74,000 21,000 26<br />
Nugaal<br />
Burtinle 26,005 7,000 0 0 0<br />
Eyl 25,259 5,000 2,000 1,000 12<br />
Garoowe 24,596 5,000 2,000 1,000 12<br />
Dan Gorayo 14,732 3,000 1,000 0 7<br />
Rural Sub‐total 90,592 20,000 5,000 2,000 8<br />
Urban 54,749 0 18,000 7,000 46<br />
Regional Total 145,341 20,000 23,000 9,000 22<br />
North Mudug<br />
Gaalkacyo 58,007 14,000 0 4,000 7<br />
Galdogob 33,366 8,000 0 2,000 6<br />
Jariiban 32,866 8,000 1,000 2,000 9<br />
Rural Sub‐total 124,239 30,000 1,000 8,000 7<br />
Urban 13,408 0 0 0 0<br />
Regional Total 137,647 30,000 1,000 8,000 7<br />
N.E. GRAND TOTAL<br />
See Appendix 5.4.2 for Footnotes<br />
650,626 111,000 98,000 38,000 21