

Fsnau-Post-Gu-2012-Technical-Report
Fsnau-Post-Gu-2012-Technical-Report
Fsnau-Post-Gu-2012-Technical-Report

You also want an ePaper? Increase the reach of your titles
YUMPU automatically turns print PDFs into web optimized ePapers that Google loves.
Regional Analysis<br />
64<br />
4.3.6 CENTRAL REGIONS<br />
Overview<br />
In this post-<strong>Gu</strong> season, the food security situation showed a slight improvement in the<br />
Central regions but a large number of the population, estimated at 165,000 people, still<br />
remains in food security crisis. Currently, the total rural population in acute food insecurity<br />
phases of Crisis and Emergency are estimated at 125,000 people, which is a 7 percent<br />
decrease from post-Deyr 2011/12 (135,000 people). Out of the affected rural population,<br />
70,000 people are in Emergency (IPC Phase 4), while 55,000 people are in Crisis<br />
(IPC Phase 3). The number of affected people in the urban areas has maintained Deyr<br />
2011/12 levels at 40,000. Over the projected period (Aug–Dec’12), the number of affected<br />
people in urban areas is likely to increase to 45,000 of which 40,000 people will be in<br />
Crisis (IPC Phase 3) and 5,000 people will be in Emergency (IPC Phase 4). Hawd and<br />
Addun livelihoods are currently in Stressed (IPC Phase 2) phase while the Cowpea Belt<br />
and Costal Deeh livelihoods sustained their previous season’s<br />
food security phase classifications (Crisis and Emergency,<br />
respectively).<br />
The improvements in the food security situation can be<br />
partly attributed to an average <strong>Gu</strong> seasonal performance in<br />
Hawd, Addun and parts of the Cowpea Belt. This improved<br />
the rangeland conditions and increased livestock and milk<br />
production, particularly in Hawd and Addun. There was also<br />
strengthened purchasing power as a result of high livestock<br />
prices and reduced cereal prices and an increased humanitarian<br />
presence in the region that had a positive impact on Hawd and<br />
Addun livelihoods.<br />
The sustained food insecurity in Coastal Deeh (Emergency)<br />
and the Cowpea Belt (Crisis) can be attributed to successive<br />
seasons of drought in the past compounded by poor <strong>Gu</strong> rainfall performance. This led to poor rangeland conditions, poor<br />
milk production, low camel calving and limited livestock holding; exacerbated by high levels of debt (USD177), constrained<br />
access to social support and the presence of destitute pastoralists. Although the number of destitute pastoralists seeking<br />
alternative income sources in urban areas and villages remained high, there were about 25-30 percent who reportedly<br />
returned to the original livelihood to try rebuild their livelihoods through kinship support. In August-December <strong>2012</strong>, the<br />
food security phase is projected to remain unchanged in all the livelihoods. Despite positive projections including good<br />
FSNAU <strong>Technical</strong> Series <strong>Report</strong> No. VI 48<br />
Issued October 18, <strong>2012</strong><br />
Central Region Livelihood<br />
Systems<br />
Table 26: Central Regions, Estimated Rural and Urban Population by District in Emergency and Crisis,<br />
Aug-Dec <strong>2012</strong><br />
District<br />
UNDP 2005<br />
Rural/Urban<br />
Population<br />
Stressed Crisis Emergency<br />
Total in Crisis &<br />
Emergency as % of<br />
Rural population<br />
South Mudug<br />
Gaalkacyo 24,860 5,000 2,000 1,000 12<br />
Hobyo 54,438 10,000 9,000 14,000 42<br />
Xarardheere 52,157 14,000 10,000 14,000 46<br />
Rural Sub‐total 131,455 29,000 21,000 29,000 38<br />
Urban 80,997 2,000 23,000 7,000 37<br />
Regional Total 212,452 31,000 44,000 36,000 38<br />
Galgaduud<br />
Cabudwaaq 32,654 6,000 1,000 4,000 15<br />
Cadaado 36,304 7,000 2,000 4,000 17<br />
Ceel Buur 66,274 17,000 11,000 3,000 21<br />
Ceel Dheer 61,407 22,000 13,000 18,000 50<br />
Dhuusamarreeb 74,441 10,000 9,000 6,000 20<br />
Rural Sub‐total 271,080 62,000 36,000 35,000 26<br />
Urban 58,977 11,000 16,000 0 27<br />
Regional Total 330,057 73,000 52,000 35,000 26<br />
CENTRAL GRAND TOTAL 542,509 104,000 96,000 71,000 31<br />
See Appendix 5.4.2 for Footnotes<br />
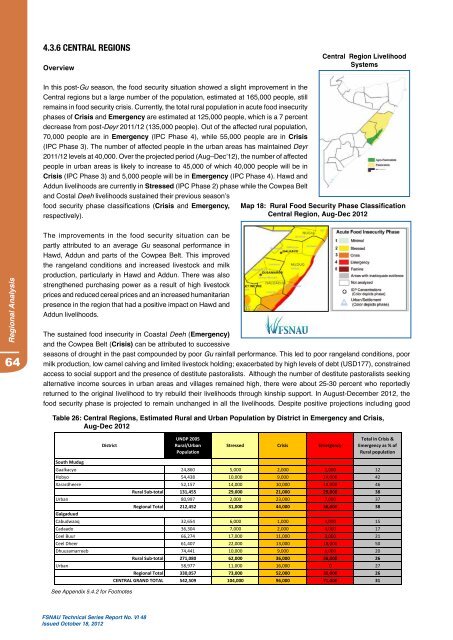
Map 18: Rural Food Security Phase Classification<br />
Central Region, Aug-Dec <strong>2012</strong>