

Fsnau-Post-Gu-2012-Technical-Report
Fsnau-Post-Gu-2012-Technical-Report
Fsnau-Post-Gu-2012-Technical-Report

Create successful ePaper yourself
Turn your PDF publications into a flip-book with our unique Google optimized e-Paper software.
Regional Analysis<br />
52<br />
4.3.3 BAY AND BAkOOL<br />
Overview<br />
The food security situation in the rural livelihoods of Bay and Bakool has improved since<br />
Deyr 2011/12, except for the Bay Agropastoral High Potential livelihood where the situation<br />
has deteriorated following the <strong>Gu</strong> <strong>2012</strong> crop failure. In July <strong>2012</strong>, the total numbers of rural<br />
population in acute food security crisis (IPC Phase 3 and 4) was estimated at 230,000<br />
in the Bay region and 80,000 in the Bakool region. This indicates a 17 percent increase<br />
in Bay and 43 percent decline in Bakool from the estimates in the post-Deyr 2011/12<br />
(Feb-Jun ’12). All livelihoods are identified in Crisis (IPC Phase 3) apart from Southern<br />
Inland Pastoral, which is in the Stressed phase (IPC Phase 2). In urban areas, the total<br />
numbers of population in acute food security crisis was estimated at 35,000 people in Bay<br />
region and 25,000 people in Bakool. This indicates a 22 percent decline in Bay region<br />
while the numbers did not change significantly in Bakool from the estimates in the post-<br />
Deyr 2011/12. In the projection period (Aug-Dec’12), the numbers of rural population<br />
in IPC Phase remains the same as in the Bay region while it<br />
decreased by 31 percent in the Bakool region to an estimated<br />
55,000 people. In the same projection period, the numbers of<br />
urban population in crisis remain the same, that is 35,000 people<br />
in Bay and 25,000 people in Bakool.<br />
Factors contributing to the current food security situation<br />
in these two regions include: poor <strong>Gu</strong> cereal production,<br />
limited agricultural labour opportunities and overstretched<br />
social support (crop gifts and zakat). Bay Agropastoral High<br />
Potential livelihood was worst affected this season because<br />
their main food and income source is from farming rather than<br />
livestock production. However, in spite of the poor seasonal<br />
performance, the rangeland conditions remained favourable<br />
owing to the residual effect from the previous good Deyr<br />
2011/11. Livestock body condition and productivity remained<br />
See Appendix 5.4.2 for Footnotes<br />
FSNAU <strong>Technical</strong> Series <strong>Report</strong> No. VI 48<br />
Issued October 18, <strong>2012</strong><br />
Sorghum Belt<br />
Livelihood Systems<br />
Table 20: Bay and Bakool, Estimated Rural and Urban Population by District in Emergency and Crisis,<br />
Aug-Dec <strong>2012</strong><br />
District<br />
UNDP 2005<br />
Rural/Urban<br />
Population<br />
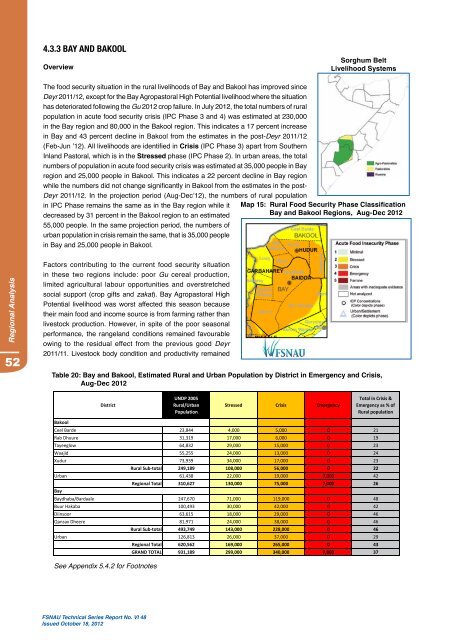
Map 15: Rural Food Security Phase Classification<br />
Bay and Bakool Regions, Aug-Dec <strong>2012</strong><br />
Stressed Crisis Emergency<br />
Total in Crisis &<br />
Emergency as % of<br />
Rural population<br />
Bakool<br />
Ceel Barde 23,844 4,000 5,000 0 21<br />
Rab Dhuure 31,319 17,000 6,000 0 19<br />
Tayeeglow 64,832 29,000 15,000 0 23<br />
Waajid 55,255 24,000 13,000 0 24<br />
Xudur 73,939 34,000 17,000 0 23<br />
Rural Sub‐total 249,189 108,000 56,000 0 22<br />
Urban 61,438 22,000 19,000 7,000 42<br />
Regional Total 310,627 130,000 75,000 7,000 26<br />
Bay<br />
Baydhaba/Bardaale 247,670 71,000 119,000 0 48<br />
Buur Hakaba 100,493 30,000 42,000 0 42<br />
Diinsoor 63,615 18,000 29,000 0 46<br />
Qansax Dheere 81,971 24,000 38,000 0 46<br />
Rural Sub‐total 493,749 143,000 228,000 0 46<br />
Urban 126,813 26,000 37,000 0 29<br />
Regional Total 620,562 169,000 265,000 0 43<br />
GRAND TOTAL 931,189 299,000 340,000 7,000 37