

Fsnau-Post-Gu-2012-Technical-Report
Fsnau-Post-Gu-2012-Technical-Report
Fsnau-Post-Gu-2012-Technical-Report

Create successful ePaper yourself
Turn your PDF publications into a flip-book with our unique Google optimized e-Paper software.
Appendices<br />
124<br />
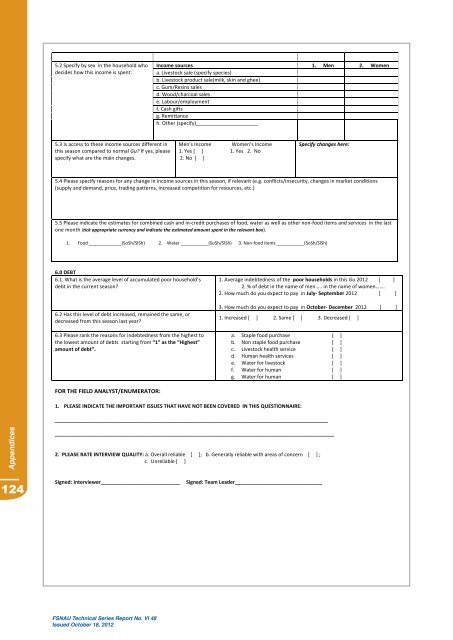
5.2 Specify by sex in the household who<br />
decides how this income is spent.<br />
5.3 Is access to these income sources different in<br />
this season compared to normal <strong>Gu</strong>? If yes, please<br />
specify what are the main changes.<br />
FSNAU <strong>Technical</strong> Series <strong>Report</strong> No. VI 48<br />
Issued October 18, <strong>2012</strong><br />
Income sources<br />
a. Livestock sale (specify species)<br />
b. Livestock product sale(milk, skin and ghee)<br />
c. <strong>Gu</strong>m/Resins sales<br />
d. Wood/charcoal sales<br />
e. Labour/employment<br />
f. Cash gifts<br />
g. Remittance<br />
h. Other (specify)______________________<br />
1. Men 2. Women<br />
Men’s Income Women’s Income<br />
1. Yes [ ] 1. Yes 2. No<br />
2. No [ ]<br />
3<br />
Specify changes here:<br />
5.4 Please specify reasons for any change in income sources in this season, if relevant (e.g. conflicts/insecurity, changes in market conditions<br />
(supply and demand, price, trading patterns, increased competition for resources, etc.)<br />
5.5 Please indicate the estimates for combined cash and in-‐credit purchases of food, water as well as other non-‐food items and services in the last<br />
one month (tick appropriate currency and indicate the estimated amount spent in the relevant box).<br />
1. Food _____________(SoSh/SlSh) 2. Water ___________(SoSh/SlSh) 3. Non-‐food items ___________(SoSh/SlSh)<br />
6.0 DEBT<br />
6.1 What is the average level of accumulated poor household’s<br />
debt in the current season?<br />
6.2 Has this level of debt increased, remained the same, or<br />
decreased from this season last year?<br />
6.3 Please rank the reasons for indebtedness from the highest to<br />
the lowest amount of debts starting from “1” as the “Highest”<br />
amount of debt”.<br />
FOR THE FIELD ANALYST/ENUMERATOR:<br />
1. Average indebtedness of the poor households in this <strong>Gu</strong> <strong>2012</strong> [ ]<br />
2. % of debt in the name of men….. in the name of women…….<br />
2. How much do you expect to pay in July-‐ September <strong>2012</strong> [ ]<br />
3. How much do you expect to pay in October-‐ December <strong>2012</strong> [ ]<br />
1. Increased [ ] 2. Same [ ] 3. Decreased [ ]<br />
a. Staple food purchase [ ]<br />
b. Non staple food purchase [ ]<br />
c. Livestock health service [ ]<br />
d. Human health services [ ]<br />
e. Water for livestock [ ]<br />
f. Water for human [ ]<br />
g. Water for human [ ]<br />
1. PLEASE INDICATE THE IMPORTANT ISSUES THAT HAVE NOT BEEN COVERED IN THIS QUESTIONNAIRE:<br />
_________________________________________________________________________________________________<br />
___________________________________________________________________________________________________<br />
2. PLEASE RATE INTERVIEW QUALITY: a. Overall reliable [ ]; b. Generally reliable with areas of concern [ ] ;<br />
c. Unreliable [ ]<br />
Signed: Interviewer____________________________ Signed: Team Leader_______________________________