

Fsnau-Post-Gu-2012-Technical-Report
Fsnau-Post-Gu-2012-Technical-Report
Fsnau-Post-Gu-2012-Technical-Report

You also want an ePaper? Increase the reach of your titles
YUMPU automatically turns print PDFs into web optimized ePapers that Google loves.
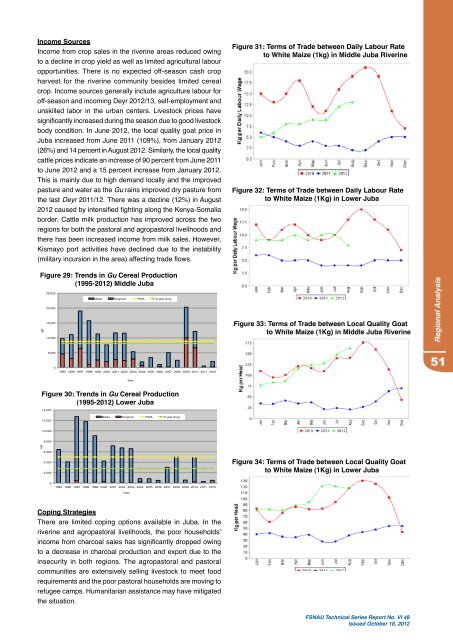
Income Sources<br />
Income from crop sales in the riverine areas reduced owing<br />
to a decline in crop yield as well as limited agricultural labour<br />
opportunities. There is no expected off-season cash crop<br />
harvest for the riverine community besides limited cereal<br />
crop. Income sources generally include agriculture labour for<br />
off-season and incoming Deyr <strong>2012</strong>/13, self-employment and<br />
unskilled labor in the urban centers. Livestock prices have<br />
significantly increased during the season due to good livestock<br />
body condition. In June <strong>2012</strong>, the local quality goat price in<br />
Juba increased from June 2011 (109%), from January <strong>2012</strong><br />
(26%) and 14 percent in August <strong>2012</strong>. Similarly, the local quality<br />
cattle prices indicate an increase of 90 percent from June 2011<br />
to June <strong>2012</strong> and a 15 percent increase from January <strong>2012</strong>.<br />
This is mainly due to high demand locally and the improved<br />
pasture and water as the <strong>Gu</strong> rains improved dry pasture from<br />
the last Deyr 2011/12. There was a decline (12%) in August<br />
<strong>2012</strong> caused by intensified fighting along the Kenya-Somalia<br />
border. Cattle milk production has improved across the two<br />
regions for both the pastoral and agropastoral livelihoods and<br />
there has been increased income from milk sales. However,<br />
Kismayo port activities have declined due to the instability<br />
(military incursion in the area) affecting trade flows.<br />
Figure 29: Trends in <strong>Gu</strong> Cereal Production<br />
(1995-<strong>2012</strong>) Middle Juba<br />
MT<br />
MT<br />
25,000<br />
20,000<br />
15,000<br />
10,000<br />
14,000<br />
12,000<br />
10,000<br />
8,000<br />
6,000<br />
4,000<br />
2,000<br />
5,000<br />
0<br />
0<br />
Maize Sorghum PWA 5 year Avrg<br />
1995 1996 1997 1998 1999 2000 2001 2002 2003 2004 2005 2006 2007 2008 2009 2010 2011 <strong>2012</strong><br />
Figure 30: Trends in <strong>Gu</strong> Cereal Production<br />
(1995-<strong>2012</strong>) Lower Juba<br />
Maize Sorghum PWA 5 year Avrg<br />
1995 1996 1997 1998 1999 2000 2001 2002 2003 2004 2005 2006 2007 2008 2009 2010 2011 <strong>2012</strong><br />
Year<br />
Year<br />
Coping Strategies<br />
There are limited coping options available in Juba. In the<br />
riverine and agropastoral livelihoods, the poor households’<br />
income from charcoal sales has significantly dropped owing<br />
to a decrease in charcoal production and export due to the<br />
insecurity in both regions. The agropastoral and pastoral<br />
communities are extensively selling livestock to meet food<br />
requirements and the poor pastoral households are moving to<br />
refugee camps. Humanitarian assistance may have mitigated<br />
the situation.<br />
Figure 31: Terms of Trade between Daily Labour Rate<br />
to White Maize (1kg) in Middle Juba Riverine<br />
Figure 32: Terms of Trade between Daily Labour Rate<br />
to White Maize (1Kg) in Lower Juba<br />
Figure 33: Terms of Trade between Local Quality Goat<br />
to White Maize (1Kg) in Middle Juba Riverine<br />
Figure 34: Terms of Trade between Local Quality Goat<br />
to White Maize (1Kg) in Lower Juba<br />
FSNAU <strong>Technical</strong> Series <strong>Report</strong> No. VI 48<br />
Issued October 18, <strong>2012</strong><br />
Regional Analysis<br />
51