

Fsnau-Post-Gu-2012-Technical-Report
Fsnau-Post-Gu-2012-Technical-Report
Fsnau-Post-Gu-2012-Technical-Report

Create successful ePaper yourself
Turn your PDF publications into a flip-book with our unique Google optimized e-Paper software.
Regional Analysis<br />
48<br />
4.3.2 LOwER AND MIDDLE JUBA REGIONS<br />
Overview<br />
<strong>Post</strong> <strong>Gu</strong> <strong>2012</strong>, the total number of rural people in acute food security crisis (IPC phases<br />
3 and 4) is estimated at 100,000 (5,000 in Emergency and 95,000 in Crisis), indicating<br />
a 41 percent reduction from the estimates from post-Deyr. The areas in Crisis include<br />
South-East Pastoral, Southern Agropastoral, Lower Juba Agropastoral and the Juba<br />
riverine livelihoods of both regions. However, improvements are visible in the Southern<br />
Inland Pastoral (camel herders), which has remained in the Stressed phase as it was in<br />
the previous Deyr season. The positive changes discerned in the food security situation<br />
are largely attributable to the previous Deyr (2011/12) season, which significantly improved<br />
the overall rangeland conditions. Resultantly there were improvements in: livestock body<br />
conditions, livestock prices and milk production. Despite the poor <strong>Gu</strong> <strong>2012</strong> crop production,<br />
the off-season harvest (Mar-Apr’12) has ensured cereal availability in the region. The<br />
ToT between livestock and cereals (maize) has considerably<br />
improved. However, despite the above improvements,<br />
substantial food and income gaps still persist among the poor<br />
agropastoral and pastoral households in most of the region<br />
as they do not have access to saleable animals owing to the<br />
effects of the previous droughts.<br />
The post <strong>Gu</strong> <strong>2012</strong> integrated nutrition situation analysis in<br />
the Juba regions indicates a sustained Very Critical situation<br />
among the agro-pastoral and riverine livelihoods since<br />
Deyr 2011/12 but an improvement from a Very Critical to<br />
Critical situation among the pastoral population. This slight<br />
improvement, especially among the pastoral population, is<br />
largely linked to an overall improved food security situation that<br />
has increased access to milk and other livestock products as<br />
well as generated an income from livestock that has enhanced<br />
household food access. However, the population in the two<br />
Juba regions still remains highly vulnerable to shocks. The current risk factors are: reduced access to humanitarian services,<br />
high morbidity burden reported AWD and measles outbreaks, poor access to health care services and sanitation, sub-optimal<br />
child feeding and care practices. All of these factors have a direct impact on the health and nutritional status of children<br />
especially, and therefore close monitoring of the situation is crucial.<br />
Table 18: Juba Estimated Rural and Urban Population by District in Emergency and Crisis, Aug-Dec <strong>2012</strong><br />
District<br />
See Appendix 5.4.2 for Footnotes<br />
FSNAU <strong>Technical</strong> Series <strong>Report</strong> No. VI 48<br />
Issued October 18, <strong>2012</strong><br />
UNDP 2005<br />
Rural/Urban<br />
Population<br />
Stressed Crisis Emergency<br />
Juba Regions Livelihood<br />
Systems<br />
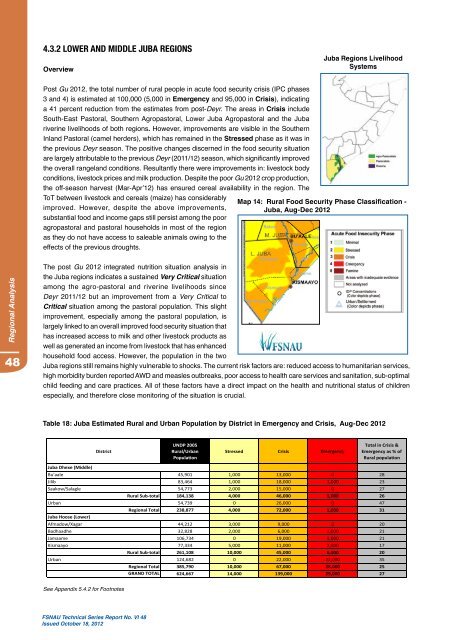
Map 14: Rural Food Security Phase Classification -<br />
Juba, Aug-Dec <strong>2012</strong><br />
Total in Crisis &<br />
Emergency as % of<br />
Rural population<br />
Juba Dhexe (Middle)<br />
Bu'aale 45,901 1,000 13,000 0 28<br />
Jilib 83,464 1,000 18,000 1,000 23<br />
Saakow/Salagle 54,773 2,000 15,000 0 27<br />
Rural Sub‐total 184,138 4,000 46,000 1,000 26<br />
Urban 54,739 0 26,000 0 47<br />
Regional Total 238,877 4,000 72,000 1,000 31<br />
Juba Hoose (Lower)<br />
Afmadow/Xagar 44,212 3,000 9,000 0 20<br />
Badhaadhe 32,828 2,000 6,000 1,000 21<br />
Jamaame 106,734 0 19,000 3,000 21<br />
Kismaayo 77,334 5,000 11,000 2,000 17<br />
Rural Sub‐total 261,108 10,000 45,000 6,000 20<br />
Urban 124,682 0 22,000 22,000 35<br />
Regional Total 385,790 10,000 67,000 28,000 25<br />
GRAND TOTAL 624,667 14,000 139,000 29,000 27