

Fsnau-Post-Gu-2012-Technical-Report
Fsnau-Post-Gu-2012-Technical-Report
Fsnau-Post-Gu-2012-Technical-Report

Create successful ePaper yourself
Turn your PDF publications into a flip-book with our unique Google optimized e-Paper software.
Regional Analysis<br />
46<br />
decreased by 2 percent compared to the same month the<br />
previous year (famine period in <strong>Gu</strong>’11) and by 22 percent<br />
in the last six months (Jan-Jun’12). Nonetheless, cash crop<br />
activities are likely to continue providing the poor households<br />
with labour opportunities in the projected period (Aug-Dec’12)<br />
and labour wages are likely to increase from September<br />
<strong>2012</strong>. The SLIM data (May <strong>2012</strong>) indicate that the number of<br />
people with access to credit decreased by 39 percent from<br />
a year ago. This is because of pending debts incurred in the<br />
previous season and increased debt levels accruing from the<br />
high cultivation and irrigation costs, particularly amongst the<br />
riverine and agropastoral communities.<br />
EFFECTS ON LIVELIHOOD STRATEGIES<br />
Agropastoralists cover their food needs (55-70%) from own<br />
production, including cereals and livestock products such<br />
as milk, meat and ghee. Purchases (cereals and sugar) are<br />
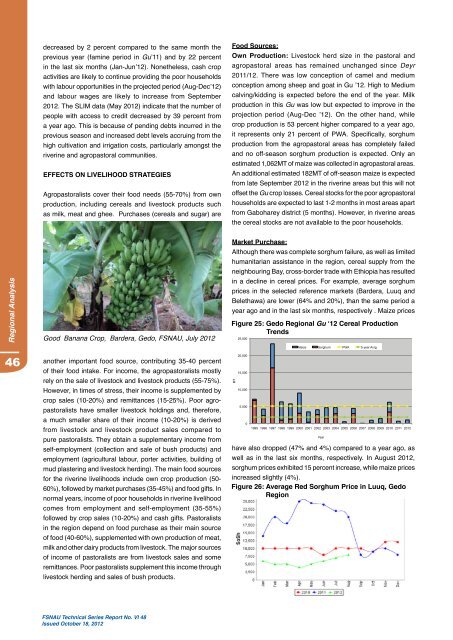
Good Banana Crop, Bardera, Gedo, FSNAU, July <strong>2012</strong><br />
another important food source, contributing 35-40 percent<br />
of their food intake. For income, the agropastoralists mostly<br />
rely on the sale of livestock and livestock products (55-75%).<br />
However, in times of stress, their income is supplemented by<br />
crop sales (10-20%) and remittances (15-25%). Poor agropastoralists<br />
have smaller livestock holdings and, therefore,<br />
a much smaller share of their income (10-20%) is derived<br />
from livestock and livestock product sales compared to<br />
pure pastoralists. They obtain a supplementary income from<br />
self-employment (collection and sale of bush products) and<br />
employment (agricultural labour, porter activities, building of<br />
mud plastering and livestock herding). The main food sources<br />
for the riverine livelihoods include own crop production (50-<br />
60%), followed by market purchases (35-45%) and food gifts. In<br />
normal years, income of poor households in riverine livelihood<br />
comes from employment and self-employment (35-55%)<br />
followed by crop sales (10-20%) and cash gifts. Pastoralists<br />
in the region depend on food purchase as their main source<br />
of food (40-60%), supplemented with own production of meat,<br />
milk and other dairy products from livestock. The major sources<br />
of income of pastoralists are from livestock sales and some<br />
remittances. Poor pastoralists supplement this income through<br />
livestock herding and sales of bush products.<br />
FSNAU <strong>Technical</strong> Series <strong>Report</strong> No. VI 48<br />
Issued October 18, <strong>2012</strong><br />
Food Sources:<br />
Own Production: Livestock herd size in the pastoral and<br />
agropastoral areas has remained unchanged since Deyr<br />
2011/12. There was low conception of camel and medium<br />
conception among sheep and goat in <strong>Gu</strong> ’12. High to Medium<br />
calving/kidding is expected before the end of the year. Milk<br />
production in this <strong>Gu</strong> was low but expected to improve in the<br />
projection period (Aug-Dec ’12). On the other hand, while<br />
crop production is 53 percent higher compared to a year ago,<br />
it represents only 21 percent of PWA. Specifically, sorghum<br />
production from the agropastoral areas has completely failed<br />
and no off-season sorghum production is expected. Only an<br />
estimated 1,062MT of maize was collected in agropastoral areas.<br />
An additional estimated 182MT of off-season maize is expected<br />
from late September <strong>2012</strong> in the riverine areas but this will not<br />
offset the <strong>Gu</strong> crop losses. Cereal stocks for the poor agropastoral<br />
households are expected to last 1-2 months in most areas apart<br />
from Gaboharey district (5 months). However, in riverine areas<br />
the cereal stocks are not available to the poor households.<br />
Market Purchase:<br />
Although there was complete sorghum failure, as well as limited<br />
humanitarian assistance in the region, cereal supply from the<br />
neighbouring Bay, cross-border trade with Ethiopia has resulted<br />
in a decline in cereal prices. For example, average sorghum<br />
prices in the selected reference markets (Bardera, Luuq and<br />
Belethawa) are lower (64% and 20%), than the same period a<br />
year ago and in the last six months, respectively . Maize prices<br />
Figure 25: Gedo Regional <strong>Gu</strong> ‘12 Cereal Production<br />
Trends<br />
MT<br />
25,000<br />
20,000<br />
15,000<br />
10,000<br />
5,000<br />
0<br />
Maize Sorghum PWA 5 year Avrg<br />
1995 1996 1997 1998 1999 2000 2001 2002 2003 2004 2005 2006 2007 2008 2009 2010 2011 <strong>2012</strong><br />
Year<br />
have also dropped (47% and 4%) compared to a year ago, as<br />
well as in the last six months, respectively. In August <strong>2012</strong>,<br />
sorghum prices exhibited 15 percent increase, while maize prices<br />
increased slightly (4%).<br />
Figure 26: Average Red Sorghum Price in Luuq, Gedo<br />
Region