

Fsnau-Post-Gu-2012-Technical-Report
Fsnau-Post-Gu-2012-Technical-Report
Fsnau-Post-Gu-2012-Technical-Report

You also want an ePaper? Increase the reach of your titles
YUMPU automatically turns print PDFs into web optimized ePapers that Google loves.
Appendices<br />
122<br />
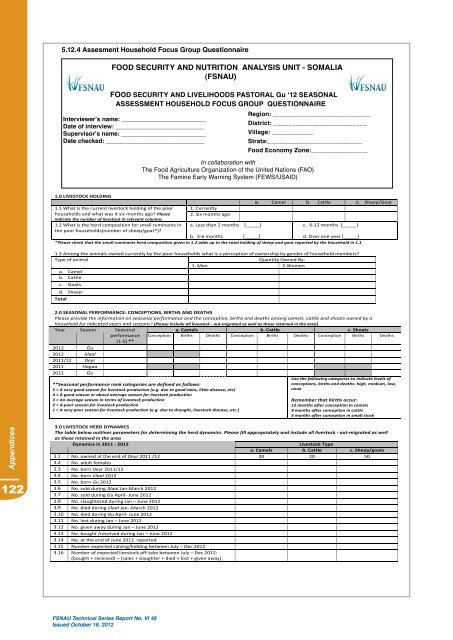
5.12.4 Assesment Household Focus Group Questionnaire<br />
FSNAU <strong>Technical</strong> Series <strong>Report</strong> No. VI 48<br />
Issued October 18, <strong>2012</strong><br />
FOOd secURiTY And nUTRiTiOn AnALYsis UniT - sOMALiA<br />
(FsnAU)<br />
FOOd secURiTY And LiVeLiHOOds pAsTORAL <strong>Gu</strong> ‘12 seAsOnAL<br />
AssessMenT HOUseHOLd FOcUs GROUp QUesTiOnnAiRe<br />
interviewer’s name: _________________________<br />
date of interview: __________________________<br />
supervisor’s name: _________________________<br />
date checked: _____________________________<br />
Region: __________________________<br />
district: _________________________<br />
Village: ___________<br />
strata:_________________________<br />
Food economy Zone:_______________<br />
In collaboration with<br />
The Food Agriculture Organization of the United Nations (FAO)<br />
The Famine Early Warning System (FEWS/USAID)<br />
1.0 LIVESTOCK HOLDING<br />
a. Camel b. Cattle c. Sheep/Goat<br />
1.1 What is the current livestock holding of the poor 1. Currently<br />
households and what was it six months ago? Please<br />
indicate the number of livestock in relevant columns<br />
2. Six months ago<br />
1.2 What is the herd composition for small ruminants in<br />
the poor households(number of sheep/goat*)?<br />
a. Less than 2 months [_____]<br />
c. 6-‐12 months [_____]<br />
b. 3-‐6 months [_____]<br />
d. Over one year [_____]<br />
*Please check that the small ruminants herd composition given in 1.2 adds up to the total holding of sheep and goat reported by the household in 1.1<br />
1.3 Among the animals owned currently by the poor households what is a perception of ownership by gender of household members?<br />
Type of animal<br />
Quantity Owned By:<br />
1. Men 2.Women<br />
a. Camel<br />
b. Cattle<br />
c. Goats<br />
d. Sheep<br />
Total<br />
2.0 SEASONAL PERFORMANCE: CONCEPTIONS, BIRTHS AND DEATHS<br />
Please provide the information on seasonal performance and the conception, births and deaths among camels, cattle and shoats owned by a<br />
household for indicated years and seasons? [Please include all livestock -‐ out-‐migrated as well as those retained in the area]<br />
Year Season Seasonal<br />
a. Camels b. Cattle c. Shoats<br />
performance<br />
(1-‐5) **<br />
Conception Births Deaths Conception Births Deaths Conception Births Deaths<br />
<strong>2012</strong> <strong>Gu</strong><br />
<strong>2012</strong> Jilaal<br />
2011/12 Deyr<br />
2011 Hagaa<br />
2011 <strong>Gu</strong><br />
**Seasonal performance rank categories are defined as follows:<br />
5 = A very good season for livestock production (e.g. due to good rains, little disease, etc)<br />
4 = A good season or above average season for livestock production<br />
3 = An average season in terms of livestock production<br />
2 = A poor season for livestock production<br />
1 = A very poor season for livestock production (e.g. due to drought, livestock disease, etc.)<br />
1<br />
Use the following categories to indicate levels of<br />
conceptions, births and deaths: high, medium, low,<br />
none<br />
Remember that births occur:<br />
12 months after conception in camels<br />
9 months after conception in cattle<br />
5 months after conception in small stock<br />
3.0 LIVESTOCK HERD DYNAMICS<br />
The table below outlines parameters for determining the herd dynamics. Please fill appropriately and include all livestock -‐ out-‐migrated as well<br />
as those retained in the area<br />
Dynamics in 2011 -‐ <strong>2012</strong><br />
Livestock Type<br />
a. Camels b. Cattle c. Sheep/goats<br />
3.1 No. owned at the end of Deyr 2011 /12 20 20 50<br />
3.2 No. adult females<br />
3.3 No. born Deyr 2011/12<br />
3.4 No. born Jilaal <strong>2012</strong><br />
3.5 No. born <strong>Gu</strong> <strong>2012</strong><br />
3.6 No. sold during JIlaal Jan-‐March <strong>2012</strong><br />
3.7 No. sold during <strong>Gu</strong> April-‐ June <strong>2012</strong><br />
3.8 No. slaughtered during Jan – June <strong>2012</strong><br />
3.9 No. died during Jilaal Jan-‐-‐March <strong>2012</strong><br />
3.10 No. died during <strong>Gu</strong> April-‐ June <strong>2012</strong><br />
3.11 No. lost during Jan – June <strong>2012</strong><br />
3.12 No. given away during Jan – June <strong>2012</strong><br />
3.13 No. bought /received during Jan – June <strong>2012</strong><br />
3.14 No. at the end of June <strong>2012</strong> reported<br />
3.15 Number expected calving/kidding between July – Dec <strong>2012</strong><br />
3.16 Number of expected livestock off-‐take between July – Dec <strong>2012</strong>:<br />
(bought + received) – (sales + slaughter + died + lost + given away)