- Page 2 and 3: (This page left blank intentionally
- Page 4 and 5: Credit Component...................
- Page 6 and 7: Tables Proposed Parks and Recreatio
- Page 8 and 9: Table VI-5 Comparison of IRC Curren
- Page 10 and 11: Maps Map III-1 Correctional Facilit
- Page 12 and 13: Appendix A Appendix B Appendix C Ap
- Page 14 and 15: o A non-charter county may adopt co
- Page 16 and 17: • Most communities make the effec
- Page 18 and 19: • Reasonable administrative costs
- Page 20 and 21: • The BCC may establish a policy
- Page 22 and 23: Table I-2 Current and Recommended S
- Page 24 and 25: Table I-4 Historical and Projected
- Page 26 and 27: (This space intentionally left blan
- Page 28 and 29: Table II-1 IRC Population Estimates
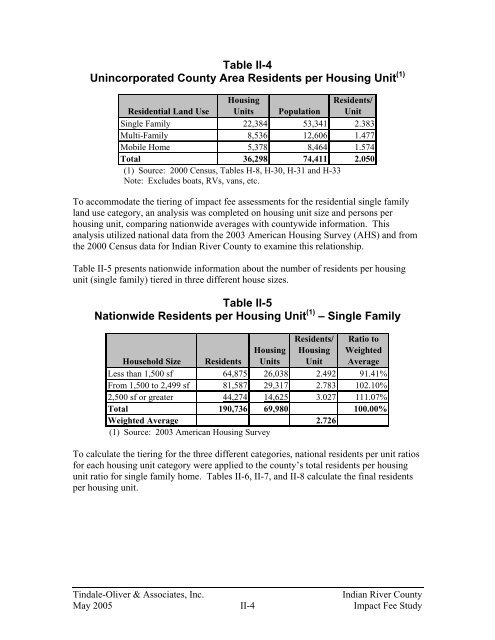
- Page 32 and 33: Table II-8 Unincorporated County Ar
- Page 34 and 35: Residential Functional Population I
- Page 36 and 37: Table II-10 11-Hour/5-Day General F
- Page 38 and 39: Table II-12 Countywide Excluding In
- Page 40 and 41: Table II-14 Countywide Functional P
- Page 42 and 43: Table II-16 Functional Residents fo
- Page 44 and 45: Table II-19 Assumptions for Nonresi
- Page 46 and 47: (This space intentionally left blan
- Page 48 and 49: Table III-1 Land & Buildings Invent
- Page 50 and 51: Tindale-Oliver & Associates, Inc. I
- Page 52 and 53: Table III-3 Level of Service Compar
- Page 54 and 55: Table III-6 Equipment Cost Equipmen
- Page 56 and 57: Table III-9 Historical Capital Expe
- Page 58 and 59: Existing Deficiencies As discussed
- Page 60 and 61: Table III-13 (continued) Impact Fee
- Page 62 and 63: Table III-15 Annual Impact Fee Reve
- Page 64 and 65: (This space intentionally left blan
- Page 66 and 67: • The SWDD also operates five cus
- Page 68 and 69: (This space intentionally left blan
- Page 70 and 71: Tindale-Oliver & Associates, Inc. I
- Page 72 and 73: Demand Component Based on the LOS s
- Page 74 and 75: Table IV-4 Proposed Capital Expendi
- Page 76 and 77: As mentioned previously, future cap
- Page 78 and 79: Table IV-7 Historical Revenue Sourc
- Page 80 and 81:
The following table provides a summ
- Page 82 and 83:
Existing Deficiencies As presented
- Page 84 and 85:
Table IV-13 Proposed Solid Waste Im
- Page 86 and 87:
Estimated Revenues As presented in
- Page 88 and 89:
Table V-1 Summary of Public Buildin
- Page 90 and 91:
Tindale-Oliver & Associates, Inc. I
- Page 92 and 93:
Services provided by County-owned a
- Page 94 and 95:
Table V-6 Public Building Replaceme
- Page 96 and 97:
Table V-8 summarizes the capital ex
- Page 98 and 99:
The vacant land value as a percenta
- Page 100 and 101:
Table V-12 Proposed Public Building
- Page 102 and 103:
Table V-13 2025 Demand and Cost For
- Page 104 and 105:
guideline in planning future infras
- Page 106 and 107:
(This space intentionally left blan
- Page 108 and 109:
Tindale-Oliver & Associates, Inc. I
- Page 110 and 111:
In addition to the available materi
- Page 112 and 113:
Table VI-5 compares the County’s
- Page 114 and 115:
Table VI-8 Building Unit Costs (1)
- Page 116 and 117:
Library Materials and Equipment The
- Page 118 and 119:
Table VI-13 Library Materials and E
- Page 120 and 121:
It should be noted that it is the C
- Page 122 and 123:
Table VI-17 Total Credit per Reside
- Page 124 and 125:
Table VI-19 Persons per Housing Uni
- Page 126 and 127:
(1) Source: Section II, Table II-1
- Page 128 and 129:
As presented in Table VI-21, the pr
- Page 130 and 131:
Table VII-1 Land & Buildings Invent
- Page 132 and 133:
Tindale-Oliver & Associates, Inc. I
- Page 134 and 135:
Table VII-3 Capital Equipment Repla
- Page 136 and 137:
Table VII-5 Current Level of Servic
- Page 138 and 139:
Table VII-7 Station Equipment Costs
- Page 140 and 141:
Table VII-10 Six-Year Historical Ca
- Page 142 and 143:
Table VII-12 Percent of Past Proper
- Page 144 and 145:
Table VII-14 Proposed Fire/EMS Impa
- Page 146 and 147:
Table VII-15 2025 Demand and Cost F
- Page 148 and 149:
guideline in planning future infras
- Page 150 and 151:
Table VIII-1 Land and Building Inve
- Page 152 and 153:
Tindale-Oliver & Associates, Inc. I
- Page 154 and 155:
unincorporated county area. The cur
- Page 156 and 157:
Table VIII-6 Equipment Cost Equipme
- Page 158 and 159:
Table VIII-8 Historical Capital Exp
- Page 160 and 161:
Table VIII-10 Vacant Land Value Per
- Page 162 and 163:
Table VIII-12 Net Impact Cost Impac
- Page 164 and 165:
Table VIII-13 (continued) Proposed
- Page 166 and 167:
Table VIII-15 Annual Impact Fee Rev
- Page 168 and 169:
(This space intentionally left blan
- Page 170 and 171:
(This space intentionally left blan
- Page 172 and 173:
Tindale-Oliver & Associates, Inc. I
- Page 174 and 175:
Cost Component Cost per Student Sta
- Page 176 and 177:
Total Impact Cost per Student Stati
- Page 178 and 179:
fees is given only for revenue used
- Page 180 and 181:
Table IX-5 2-Mill Revenue Credit Ca
- Page 182 and 183:
Table IX-7 Net Impact Cost per Stud
- Page 184 and 185:
Table IX-10 2025 Demand and Cost Fo
- Page 186 and 187:
As presented in Table IX-10, the pr
- Page 188 and 189:
(This space intentionally left blan
- Page 191:
Table X-1 (Continued) Parks & Recre
- Page 194 and 195:
Tindale-Oliver & Associates, Inc. I
- Page 196 and 197:
Table X-2 Parks & Recreation Facili
- Page 198 and 199:
was calculated using historical exp
- Page 200 and 201:
Table X-7 Regional Parks Equipment/
- Page 202 and 203:
Table X-9 Programmed Capital Costs
- Page 204 and 205:
Table X-11 Historical Capital Expen
- Page 206 and 207:
Table X-13 Vacant Land Value Percen
- Page 208 and 209:
Table X-15 Net Impact Cost per Resi
- Page 210 and 211:
Table X-18 2025 Demand and Cost For
- Page 212 and 213:
For impact fee purposes, revenue pr
- Page 214 and 215:
(This page left blank intentionally
- Page 216 and 217:
Table A-3 24-Hour Baseline - Uninco
- Page 218 and 219:
Table A-7 24-Hour Functional Popula
- Page 220 and 221:
The resulting percentages from Tabl
- Page 222 and 223:
Table A-14 IRC Weighted Average Sea
- Page 224 and 225:
(This page left blank intentionally
- Page 226 and 227:
(This page left blank intentionally
- Page 228 and 229:
(This page left blank intentionally
- Page 230 and 231:
Table C-1 Proposed Solid Waste Impa
- Page 232 and 233:
(This page left blank intentionally
- Page 234 and 235:
(This page left blank intentionally
- Page 236 and 237:
Table D-2 IRC School District Inven
- Page 238 and 239:
(This page left blank intentionally
- Page 240 and 241:
(This page left blank intentionally
- Page 242 and 243:
Table F-2 Inventory of Available Im
- Page 244 and 245:
Table F-2 Inventory of Available Im
- Page 246 and 247:
Table F-3-2 Comparison of Standards
- Page 248 and 249:
County SF per Capita Table F-3-4 Co
- Page 250 and 251:
Table F-3-6 Comparison of Standards
- Page 252 and 253:
Table F-3-8 Comparison of Standards
- Page 254 and 255:
(This page left blank intentionally
- Page 256 and 257:
(This page left blank intentionally
- Page 258 and 259:
Table G-2 Solid Waste - Residential
- Page 260 and 261:
Table G-4 Library Facilities - Resi
- Page 262 and 263:
Table G-6 Law Enforcement - Residen
- Page 264 and 265:
Table G-8 Park and Recreation Facil
- Page 266 and 267:
(This page left blank intentionally
- Page 268 and 269:
Presentation Overview 1 2 3 4 5 6 B
- Page 270 and 271:
Background • BCC initiated study
- Page 272 and 273:
Decision Points Decision Points Enc
- Page 274 and 275:
Basic Impact Fee Formula Impact Fee
- Page 276 and 277:
Distribution of Impact Fees Transpo
- Page 278 and 279:
2 Legal Requirements
- Page 280 and 281:
Impact Fee vs. Tax • An impact fe
- Page 282 and 283:
Authority in IRC • Non-charter co
- Page 284 and 285:
Defendable Methodology • Study th
- Page 286 and 287:
Revenue Credits • Ensure proporti
- Page 288 and 289:
Administration • Must be easy to
- Page 290 and 291:
Effective Date • May be effective
- Page 292 and 293:
Applicability • Creates a measura
- Page 294 and 295:
Decision Point Will each city enter
- Page 296 and 297:
Imposition & Collection • As earl
- Page 298 and 299:
Use of Impact Fee Revenue • Must
- Page 300 and 301:
Decision Point The consultant recom
- Page 302 and 303:
Decision Point The consultant recom
- Page 304 and 305:
Decision Point The consultant recom
- Page 306 and 307:
Decision Points The consultant reco
- Page 308 and 309:
4 LOS Standards
- Page 310 and 311:
Decision Point The consultant recom
- Page 312 and 313:
Impact Fee Comparisons • Single F
- Page 314 and 315:
5 Funding Sources (see Table 4)
- Page 316 and 317:
Decision Point Does the BCC want to
- Page 318:
Next Steps • Finalize Data Collec