Indian River County Impact Fee Study Final Report - irccdd.com
Indian River County Impact Fee Study Final Report - irccdd.com
Indian River County Impact Fee Study Final Report - irccdd.com

Create successful ePaper yourself
Turn your PDF publications into a flip-book with our unique Google optimized e-Paper software.
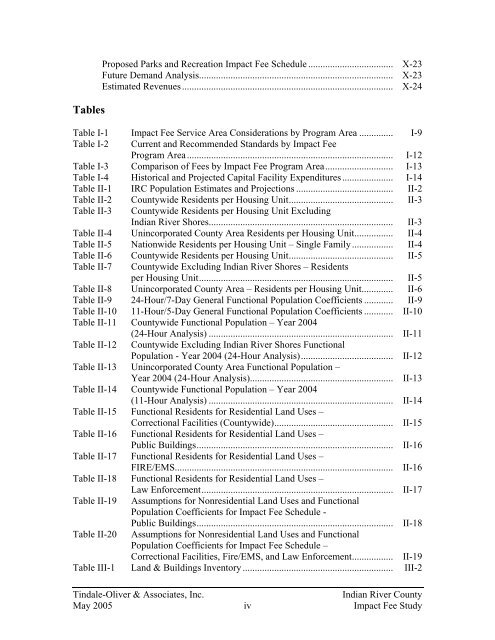
Tables<br />
Proposed Parks and Recreation <strong>Impact</strong> <strong>Fee</strong> Schedule ................................... X-23<br />
Future Demand Analysis................................................................................ X-23<br />
Estimated Revenues....................................................................................... X-24<br />
Table I-1 <strong>Impact</strong> <strong>Fee</strong> Service Area Considerations by Program Area .............. I-9<br />
Table I-2 Current and Re<strong>com</strong>mended Standards by <strong>Impact</strong> <strong>Fee</strong><br />
Program Area..................................................................................... I-12<br />
Table I-3 Comparison of <strong>Fee</strong>s by <strong>Impact</strong> <strong>Fee</strong> Program Area............................ I-13<br />
Table I-4 Historical and Projected Capital Facility Expenditures..................... I-14<br />
Table II-1 IRC Population Estimates and Projections ........................................ II-2<br />
Table II-2 <strong>County</strong>wide Residents per Housing Unit........................................... II-3<br />
Table II-3 <strong>County</strong>wide Residents per Housing Unit Excluding<br />
<strong>Indian</strong> <strong>River</strong> Shores............................................................................ II-3<br />
Table II-4 Unincorporated <strong>County</strong> Area Residents per Housing Unit................ II-4<br />
Table II-5 Nationwide Residents per Housing Unit – Single Family................. II-4<br />
Table II-6 <strong>County</strong>wide Residents per Housing Unit........................................... II-5<br />
Table II-7 <strong>County</strong>wide Excluding <strong>Indian</strong> <strong>River</strong> Shores – Residents<br />
per Housing Unit................................................................................ II-5<br />
Table II-8 Unincorporated <strong>County</strong> Area – Residents per Housing Unit............. II-6<br />
Table II-9 24-Hour/7-Day General Functional Population Coefficients ............ II-9<br />
Table II-10 11-Hour/5-Day General Functional Population Coefficients ............ II-10<br />
Table II-11 <strong>County</strong>wide Functional Population – Year 2004<br />
(24-Hour Analysis) ............................................................................ II-11<br />
Table II-12<br />
<strong>County</strong>wide Excluding <strong>Indian</strong> <strong>River</strong> Shores Functional<br />
Population - Year 2004 (24-Hour Analysis)...................................... II-12<br />
Table II-13 Unincorporated <strong>County</strong> Area Functional Population –<br />
Year 2004 (24-Hour Analysis)........................................................... II-13<br />
Table II-14 <strong>County</strong>wide Functional Population – Year 2004<br />
(11-Hour Analysis) ............................................................................ II-14<br />
Table II-15 Functional Residents for Residential Land Uses –<br />
Correctional Facilities (<strong>County</strong>wide)................................................. II-15<br />
Table II-16 Functional Residents for Residential Land Uses –<br />
Public Buildings................................................................................. II-16<br />
Table II-17 Functional Residents for Residential Land Uses –<br />
FIRE/EMS.......................................................................................... II-16<br />
Table II-18 Functional Residents for Residential Land Uses –<br />
Law Enforcement............................................................................... II-17<br />
Table II-19<br />
Assumptions for Nonresidential Land Uses and Functional<br />
Population Coefficients for <strong>Impact</strong> <strong>Fee</strong> Schedule -<br />
Public Buildings................................................................................. II-18<br />
Table II-20 Assumptions for Nonresidential Land Uses and Functional<br />
Population Coefficients for <strong>Impact</strong> <strong>Fee</strong> Schedule –<br />
Correctional Facilities, Fire/EMS, and Law Enforcement................. II-19<br />
Table III-1 Land & Buildings Inventory .............................................................. III-2<br />
Tindale-Oliver & Associates, Inc.<br />
<strong>Indian</strong> <strong>River</strong> <strong>County</strong><br />
May 2005 iv <strong>Impact</strong> <strong>Fee</strong> <strong>Study</strong>