San Luis Obispo - Caltrans - State of California
San Luis Obispo - Caltrans - State of California
San Luis Obispo - Caltrans - State of California

You also want an ePaper? Increase the reach of your titles
YUMPU automatically turns print PDFs into web optimized ePapers that Google loves.
SAN LUIS OBISPO REGION<br />
COORDINATED HUMAN SERVICES-PUBLIC TRANSPORTATION PLAN<br />
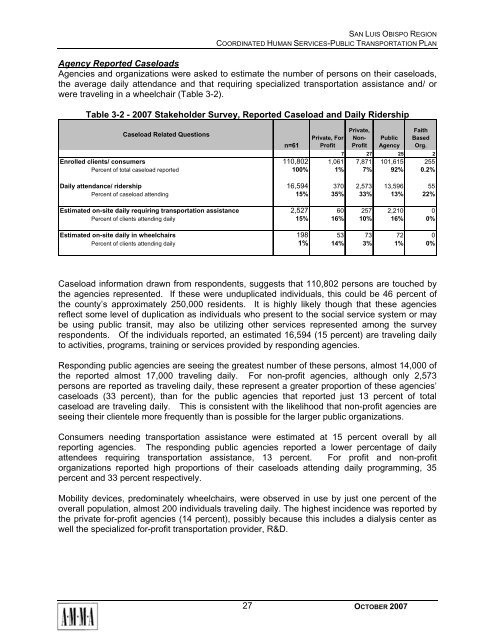
Agency Reported Caseloads<br />
Agencies and organizations were asked to estimate the number <strong>of</strong> persons on their caseloads,<br />
the average daily attendance and that requiring specialized transportation assistance and/ or<br />
were traveling in a wheelchair (Table 3-2).<br />
Table 3-2 - 2007 Stakeholder Survey, Reported Caseload and Daily Ridership<br />
Caseload Related Questions<br />
n=61<br />
Private, For<br />
Pr<strong>of</strong>it<br />
Private,<br />
Non-<br />
Pr<strong>of</strong>it<br />
Public<br />
Agency<br />
Faith<br />
Based<br />
Org.<br />
7 27 25 2<br />
Enrolled clients/ consumers 110,802 1,061 7,871 101,615 255<br />
Percent <strong>of</strong> total caseload reported 100% 1% 7% 92% 0.2%<br />
Daily attendance/ ridership 16,594 370 2,573 13,596 55<br />
Percent <strong>of</strong> caseload attending 15% 35% 33% 13% 22%<br />
Estimated on-site daily requiring transportation assistance 2,527 60 257 2,210 0<br />
Percent <strong>of</strong> clients attending daily 15% 16% 10% 16% 0%<br />
Estimated on-site daily in wheelchairs 198 53 73 72 0<br />
Percent <strong>of</strong> clients attending daily 1% 14% 3% 1% 0%<br />
Caseload information drawn from respondents, suggests that 110,802 persons are touched by<br />
the agencies represented. If these were unduplicated individuals, this could be 46 percent <strong>of</strong><br />
the county’s approximately 250,000 residents. It is highly likely though that these agencies<br />
reflect some level <strong>of</strong> duplication as individuals who present to the social service system or may<br />
be using public transit, may also be utilizing other services represented among the survey<br />
respondents. Of the individuals reported, an estimated 16,594 (15 percent) are traveling daily<br />
to activities, programs, training or services provided by responding agencies.<br />
Responding public agencies are seeing the greatest number <strong>of</strong> these persons, almost 14,000 <strong>of</strong><br />
the reported almost 17,000 traveling daily. For non-pr<strong>of</strong>it agencies, although only 2,573<br />
persons are reported as traveling daily, these represent a greater proportion <strong>of</strong> these agencies’<br />
caseloads (33 percent), than for the public agencies that reported just 13 percent <strong>of</strong> total<br />
caseload are traveling daily. This is consistent with the likelihood that non-pr<strong>of</strong>it agencies are<br />
seeing their clientele more frequently than is possible for the larger public organizations.<br />
Consumers needing transportation assistance were estimated at 15 percent overall by all<br />
reporting agencies. The responding public agencies reported a lower percentage <strong>of</strong> daily<br />
attendees requiring transportation assistance, 13 percent. For pr<strong>of</strong>it and non-pr<strong>of</strong>it<br />
organizations reported high proportions <strong>of</strong> their caseloads attending daily programming, 35<br />
percent and 33 percent respectively.<br />
Mobility devices, predominately wheelchairs, were observed in use by just one percent <strong>of</strong> the<br />
overall population, almost 200 individuals traveling daily. The highest incidence was reported by<br />
the private for-pr<strong>of</strong>it agencies (14 percent), possibly because this includes a dialysis center as<br />
well the specialized for-pr<strong>of</strong>it transportation provider, R&D.<br />
27<br />
OCTOBER 2007