San Luis Obispo - Caltrans - State of California
San Luis Obispo - Caltrans - State of California
San Luis Obispo - Caltrans - State of California

You also want an ePaper? Increase the reach of your titles
YUMPU automatically turns print PDFs into web optimized ePapers that Google loves.
SAN LUIS OBISPO REGION<br />
COORDINATED HUMAN SERVICES-PUBLIC TRANSPORTATION PLAN<br />
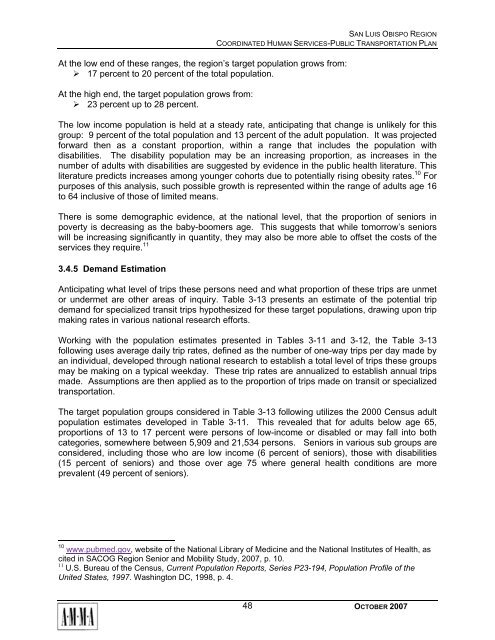
At the low end <strong>of</strong> these ranges, the region’s target population grows from:<br />
‣ 17 percent to 20 percent <strong>of</strong> the total population.<br />
At the high end, the target population grows from:<br />
‣ 23 percent up to 28 percent.<br />
The low income population is held at a steady rate, anticipating that change is unlikely for this<br />
group: 9 percent <strong>of</strong> the total population and 13 percent <strong>of</strong> the adult population. It was projected<br />
forward then as a constant proportion, within a range that includes the population with<br />
disabilities. The disability population may be an increasing proportion, as increases in the<br />
number <strong>of</strong> adults with disabilities are suggested by evidence in the public health literature. This<br />
literature predicts increases among younger cohorts due to potentially rising obesity rates. 10 For<br />
purposes <strong>of</strong> this analysis, such possible growth is represented within the range <strong>of</strong> adults age 16<br />
to 64 inclusive <strong>of</strong> those <strong>of</strong> limited means.<br />
There is some demographic evidence, at the national level, that the proportion <strong>of</strong> seniors in<br />
poverty is decreasing as the baby-boomers age. This suggests that while tomorrow’s seniors<br />
will be increasing significantly in quantity, they may also be more able to <strong>of</strong>fset the costs <strong>of</strong> the<br />
services they require. 11<br />
3.4.5 Demand Estimation<br />
Anticipating what level <strong>of</strong> trips these persons need and what proportion <strong>of</strong> these trips are unmet<br />
or undermet are other areas <strong>of</strong> inquiry. Table 3-13 presents an estimate <strong>of</strong> the potential trip<br />
demand for specialized transit trips hypothesized for these target populations, drawing upon trip<br />
making rates in various national research efforts.<br />
Working with the population estimates presented in Tables 3-11 and 3-12, the Table 3-13<br />
following uses average daily trip rates, defined as the number <strong>of</strong> one-way trips per day made by<br />
an individual, developed through national research to establish a total level <strong>of</strong> trips these groups<br />
may be making on a typical weekday. These trip rates are annualized to establish annual trips<br />
made. Assumptions are then applied as to the proportion <strong>of</strong> trips made on transit or specialized<br />
transportation.<br />
The target population groups considered in Table 3-13 following utilizes the 2000 Census adult<br />
population estimates developed in Table 3-11. This revealed that for adults below age 65,<br />
proportions <strong>of</strong> 13 to 17 percent were persons <strong>of</strong> low-income or disabled or may fall into both<br />
categories, somewhere between 5,909 and 21,534 persons. Seniors in various sub groups are<br />
considered, including those who are low income (6 percent <strong>of</strong> seniors), those with disabilities<br />
(15 percent <strong>of</strong> seniors) and those over age 75 where general health conditions are more<br />
prevalent (49 percent <strong>of</strong> seniors).<br />
10 www.pubmed.gov, website <strong>of</strong> the National Library <strong>of</strong> Medicine and the National Institutes <strong>of</strong> Health, as<br />
cited in SACOG Region Senior and Mobility Study, 2007, p. 10.<br />
11 U.S. Bureau <strong>of</strong> the Census, Current Population Reports, Series P23-194, Population Pr<strong>of</strong>ile <strong>of</strong> the<br />
United <strong>State</strong>s, 1997. Washington DC, 1998, p. 4.<br />
48<br />
OCTOBER 2007