San Luis Obispo - Caltrans - State of California
San Luis Obispo - Caltrans - State of California
San Luis Obispo - Caltrans - State of California

You also want an ePaper? Increase the reach of your titles
YUMPU automatically turns print PDFs into web optimized ePapers that Google loves.
SAN LUIS OBISPO REGION<br />
COORDINATED HUMAN SERVICES-PUBLIC TRANSPORTATION PLAN<br />
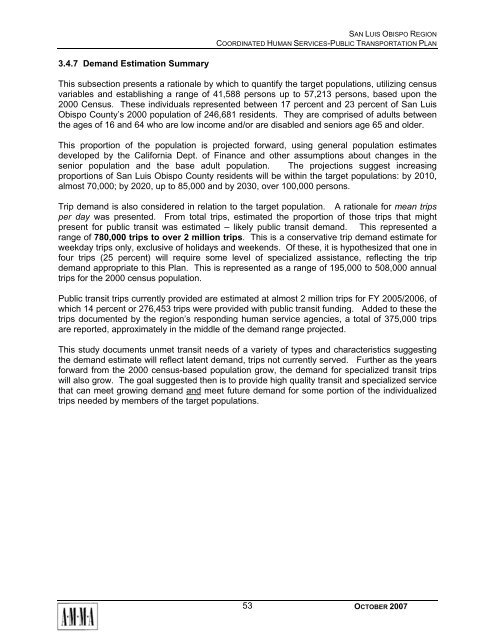
3.4.7 Demand Estimation Summary<br />
This subsection presents a rationale by which to quantify the target populations, utilizing census<br />
variables and establishing a range <strong>of</strong> 41,588 persons up to 57,213 persons, based upon the<br />
2000 Census. These individuals represented between 17 percent and 23 percent <strong>of</strong> <strong>San</strong> <strong>Luis</strong><br />
<strong>Obispo</strong> County’s 2000 population <strong>of</strong> 246,681 residents. They are comprised <strong>of</strong> adults between<br />
the ages <strong>of</strong> 16 and 64 who are low income and/or are disabled and seniors age 65 and older.<br />
This proportion <strong>of</strong> the population is projected forward, using general population estimates<br />
developed by the <strong>California</strong> Dept. <strong>of</strong> Finance and other assumptions about changes in the<br />
senior population and the base adult population. The projections suggest increasing<br />
proportions <strong>of</strong> <strong>San</strong> <strong>Luis</strong> <strong>Obispo</strong> County residents will be within the target populations: by 2010,<br />
almost 70,000; by 2020, up to 85,000 and by 2030, over 100,000 persons.<br />
Trip demand is also considered in relation to the target population. A rationale for mean trips<br />
per day was presented. From total trips, estimated the proportion <strong>of</strong> those trips that might<br />
present for public transit was estimated – likely public transit demand. This represented a<br />
range <strong>of</strong> 780,000 trips to over 2 million trips. This is a conservative trip demand estimate for<br />
weekday trips only, exclusive <strong>of</strong> holidays and weekends. Of these, it is hypothesized that one in<br />
four trips (25 percent) will require some level <strong>of</strong> specialized assistance, reflecting the trip<br />
demand appropriate to this Plan. This is represented as a range <strong>of</strong> 195,000 to 508,000 annual<br />
trips for the 2000 census population.<br />
Public transit trips currently provided are estimated at almost 2 million trips for FY 2005/2006, <strong>of</strong><br />
which 14 percent or 276,453 trips were provided with public transit funding. Added to these the<br />
trips documented by the region’s responding human service agencies, a total <strong>of</strong> 375,000 trips<br />
are reported, approximately in the middle <strong>of</strong> the demand range projected.<br />
This study documents unmet transit needs <strong>of</strong> a variety <strong>of</strong> types and characteristics suggesting<br />
the demand estimate will reflect latent demand, trips not currently served. Further as the years<br />
forward from the 2000 census-based population grow, the demand for specialized transit trips<br />
will also grow. The goal suggested then is to provide high quality transit and specialized service<br />
that can meet growing demand and meet future demand for some portion <strong>of</strong> the individualized<br />
trips needed by members <strong>of</strong> the target populations.<br />
53<br />
OCTOBER 2007