San Luis Obispo - Caltrans - State of California
San Luis Obispo - Caltrans - State of California
San Luis Obispo - Caltrans - State of California

You also want an ePaper? Increase the reach of your titles
YUMPU automatically turns print PDFs into web optimized ePapers that Google loves.
SAN LUIS OBISPO REGION<br />
COORDINATED HUMAN SERVICES-PUBLIC TRANSPORTATION PLAN<br />
The public transit agencies are reporting a larger fleet <strong>of</strong> back-up vehicles, with 75 percent <strong>of</strong><br />
their vehicles used daily, in contrast with human services agencies where 86 percent <strong>of</strong> reported<br />
vehicles are in use daily. Public transit vehicles tend to be larger and are more likely to be liftequipped.<br />
Human service agency vehicles are more likely to be smaller and only 3 percent <strong>of</strong><br />
vehicles reported are lift-equipped.<br />
Vehicle Use<br />
The utilization <strong>of</strong> vehicles is <strong>of</strong> paramount interest to this inquiry as it suggests a baseline <strong>of</strong><br />
services now provided and a means by which to measure increases in the quantities <strong>of</strong> services<br />
provided, over time. Reported data is presented below in Table 3-8.<br />
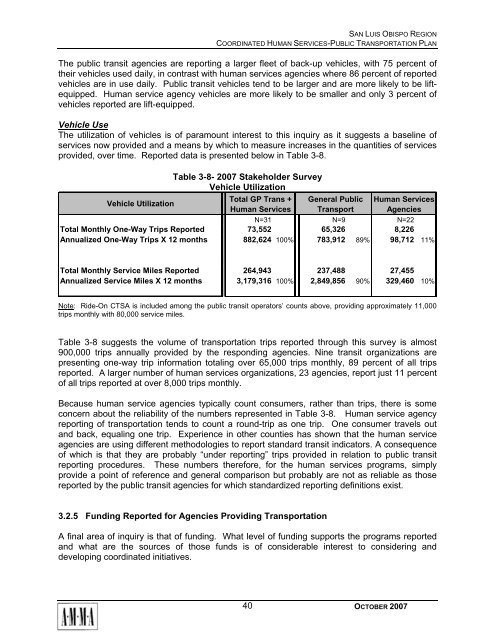
Table 3-8- 2007 Stakeholder Survey<br />
Vehicle Utilization<br />
Vehicle Utilization<br />
Total GP Trans + General Public Human Services<br />
Human Services Transport Agencies<br />
N=31 N=9 N=22<br />
Total Monthly One-Way Trips Reported 73,552 65,326 8,226<br />
Annualized One-Way Trips X 12 months 882,624 100% 783,912 89% 98,712 11%<br />
Total Monthly Service Miles Reported 264,943 237,488 27,455<br />
Annualized Service Miles X 12 months 3,179,316 100% 2,849,856 90% 329,460 10%<br />
Note: Ride-On CTSA is included among the public transit operators’ counts above, providing approximately 11,000<br />
trips monthly with 80,000 service miles.<br />
Table 3-8 suggests the volume <strong>of</strong> transportation trips reported through this survey is almost<br />
900,000 trips annually provided by the responding agencies. Nine transit organizations are<br />
presenting one-way trip information totaling over 65,000 trips monthly, 89 percent <strong>of</strong> all trips<br />
reported. A larger number <strong>of</strong> human services organizations, 23 agencies, report just 11 percent<br />
<strong>of</strong> all trips reported at over 8,000 trips monthly.<br />
Because human service agencies typically count consumers, rather than trips, there is some<br />
concern about the reliability <strong>of</strong> the numbers represented in Table 3-8. Human service agency<br />
reporting <strong>of</strong> transportation tends to count a round-trip as one trip. One consumer travels out<br />
and back, equaling one trip. Experience in other counties has shown that the human service<br />
agencies are using different methodologies to report standard transit indicators. A consequence<br />
<strong>of</strong> which is that they are probably “under reporting” trips provided in relation to public transit<br />
reporting procedures. These numbers therefore, for the human services programs, simply<br />
provide a point <strong>of</strong> reference and general comparison but probably are not as reliable as those<br />
reported by the public transit agencies for which standardized reporting definitions exist.<br />
3.2.5 Funding Reported for Agencies Providing Transportation<br />
A final area <strong>of</strong> inquiry is that <strong>of</strong> funding. What level <strong>of</strong> funding supports the programs reported<br />
and what are the sources <strong>of</strong> those funds is <strong>of</strong> considerable interest to considering and<br />
developing coordinated initiatives.<br />
40<br />
OCTOBER 2007