San Luis Obispo - Caltrans - State of California
San Luis Obispo - Caltrans - State of California
San Luis Obispo - Caltrans - State of California

You also want an ePaper? Increase the reach of your titles
YUMPU automatically turns print PDFs into web optimized ePapers that Google loves.
SAN LUIS OBISPO REGION<br />
COORDINATED HUMAN SERVICES-PUBLIC TRANSPORTATION PLAN<br />
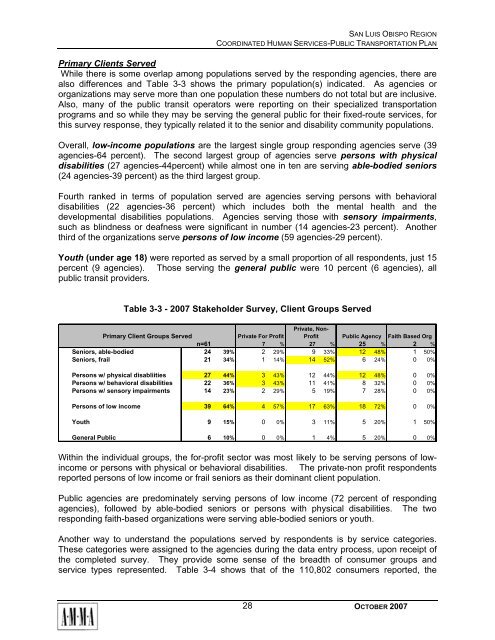
Primary Clients Served<br />
While there is some overlap among populations served by the responding agencies, there are<br />
also differences and Table 3-3 shows the primary population(s) indicated. As agencies or<br />
organizations may serve more than one population these numbers do not total but are inclusive.<br />
Also, many <strong>of</strong> the public transit operators were reporting on their specialized transportation<br />
programs and so while they may be serving the general public for their fixed-route services, for<br />
this survey response, they typically related it to the senior and disability community populations.<br />
Overall, low-income populations are the largest single group responding agencies serve (39<br />
agencies-64 percent). The second largest group <strong>of</strong> agencies serve persons with physical<br />
disabilities (27 agencies-44percent) while almost one in ten are serving able-bodied seniors<br />
(24 agencies-39 percent) as the third largest group.<br />
Fourth ranked in terms <strong>of</strong> population served are agencies serving persons with behavioral<br />
disabilities (22 agencies-36 percent) which includes both the mental health and the<br />
developmental disabilities populations. Agencies serving those with sensory impairments,<br />
such as blindness or deafness were significant in number (14 agencies-23 percent). Another<br />
third <strong>of</strong> the organizations serve persons <strong>of</strong> low income (59 agencies-29 percent).<br />
Youth (under age 18) were reported as served by a small proportion <strong>of</strong> all respondents, just 15<br />
percent (9 agencies). Those serving the general public were 10 percent (6 agencies), all<br />
public transit providers.<br />
Table 3-3 - 2007 Stakeholder Survey, Client Groups Served<br />
Private, Non-<br />
Primary Client Groups Served<br />
Private For Pr<strong>of</strong>it Pr<strong>of</strong>it Public Agency Faith Based Org<br />
n=61 7 % 27 % 25 % 2 %<br />
Seniors, able-bodied 24 39% 2 29% 9 33% 12 48% 1 50%<br />
Seniors, frail 21 34% 1 14% 14 52% 6 24% 0 0%<br />
Persons w/ physical disabliities 27 44% 3 43% 12 44% 12 48% 0 0%<br />
Persons w/ behavioral disabilities 22 36% 3 43% 11 41% 8 32% 0 0%<br />
Persons w/ sensory impairments 14 23% 2 29% 5 19% 7 28% 0 0%<br />
Persons <strong>of</strong> low income 39 64% 4 57% 17 63% 18 72% 0 0%<br />
Youth 9 15% 0 0% 3 11% 5 20% 1 50%<br />
General Public 6 10% 0 0% 1 4% 5 20% 0 0%<br />
Within the individual groups, the for-pr<strong>of</strong>it sector was most likely to be serving persons <strong>of</strong> lowincome<br />
or persons with physical or behavioral disabilities. The private-non pr<strong>of</strong>it respondents<br />
reported persons <strong>of</strong> low income or frail seniors as their dominant client population.<br />
Public agencies are predominately serving persons <strong>of</strong> low income (72 percent <strong>of</strong> responding<br />
agencies), followed by able-bodied seniors or persons with physical disabilities. The two<br />
responding faith-based organizations were serving able-bodied seniors or youth.<br />
Another way to understand the populations served by respondents is by service categories.<br />
These categories were assigned to the agencies during the data entry process, upon receipt <strong>of</strong><br />
the completed survey. They provide some sense <strong>of</strong> the breadth <strong>of</strong> consumer groups and<br />
service types represented. Table 3-4 shows that <strong>of</strong> the 110,802 consumers reported, the<br />
28<br />
OCTOBER 2007