San Luis Obispo - Caltrans - State of California
San Luis Obispo - Caltrans - State of California
San Luis Obispo - Caltrans - State of California

You also want an ePaper? Increase the reach of your titles
YUMPU automatically turns print PDFs into web optimized ePapers that Google loves.
SAN LUIS OBISPO REGION<br />
COORDINATED HUMAN SERVICES-PUBLIC TRANSPORTATION PLAN<br />
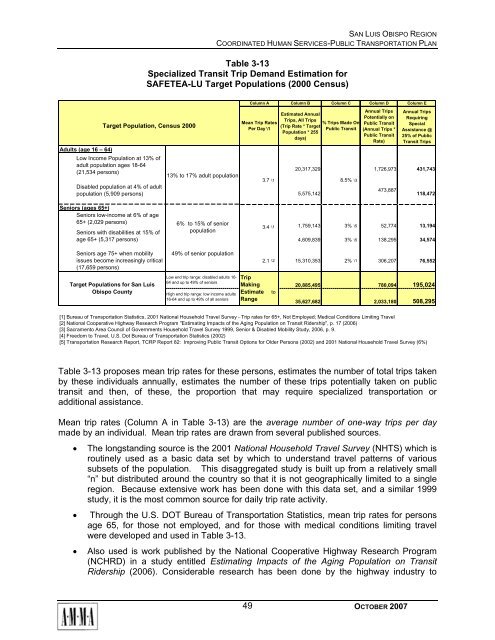
Table 3-13<br />
Specialized Transit Trip Demand Estimation for<br />
SAFETEA-LU Target Populations (2000 Census)<br />
Target Population, Census 2000<br />
Column B Column C Column D Column E<br />
Estimated Annual<br />
Trips, All Trips<br />
(Trip Rate * Target<br />
Population * 255<br />
days)<br />
Adults (age 16 – 64)<br />
Low Income Population at 13% <strong>of</strong><br />
adult population ages 18-64<br />
20,317,329<br />
(21,534 persons)<br />
13% to 17% adult population<br />
3.7 \1<br />
Disabled population at 4% <strong>of</strong> adult<br />
population (5,909 persons) 5,575,142<br />
8.5% \3<br />
Annual Trips<br />
Potentially on<br />
Public Transit<br />
(Annual Trips *<br />
Public Transit<br />
Rate)<br />
Annual Trips<br />
Requiring<br />
Special<br />
Assistance @<br />
25% <strong>of</strong> Public<br />
Transit Trips<br />
1,726,973 431,743<br />
Seniors (ages 65+)<br />
Seniors low-income at 6% <strong>of</strong> age<br />
65+ (2,029 persons)<br />
6% to 15% <strong>of</strong> senior<br />
Seniors with disabilities at 15% <strong>of</strong><br />
population<br />
3.4 \1 1,759,143 3% \5 52,774 13,194<br />
age 65+ (5,317 persons) 4,609,839 3% \5 138,295 34,574<br />
Seniors age 75+ when mobility<br />
issues become increasingly critical<br />
(17,659 persons)<br />
Target Populations for <strong>San</strong> <strong>Luis</strong><br />
<strong>Obispo</strong> County<br />
49% <strong>of</strong> senior population<br />
Low end trip range: disabled adults 16-<br />
64 and up to 49% <strong>of</strong> seniors<br />
High end trip range: low income adults<br />
16-64 and up to 49% <strong>of</strong> all seniors<br />
Column A<br />
Mean Trip Rates<br />
Per Day \1<br />
Trip<br />
Making<br />
Estimate<br />
Range<br />
473,887<br />
118,472<br />
2.1 \2 15,310,353 2% \1 306,207 76,552<br />
to<br />
% Trips Made On<br />
Public Transit<br />
20,885,495 780,094 195,024<br />
35,627,682 2,033,180 508,295<br />
[1] Bureau <strong>of</strong> Transportation Statistics, 2001 National Household Travel Survey - Trip rates for 65+, Not Employed; Medical Conditions Limiting Travel<br />
[2] National Cooperative Highway Research Program "Estimating Impacts <strong>of</strong> the Aging Population on Transit Ridership", p. 17 (2006)<br />
[3] Sacramento Area Council <strong>of</strong> Governments Household Travel Survey 1999, Senior & Disabled Mobility Study, 2006, p. 9.<br />
[4] Freedom to Travel, U.S. Dot Bureau <strong>of</strong> Transportation Statistics (2002)<br />
[5] Transportation Research Report, TCRP Report 82: Improving Public Transit Options for Older Persons (2002) and 2001 National Household Travel Survey (6%)<br />
Table 3-13 proposes mean trip rates for these persons, estimates the number <strong>of</strong> total trips taken<br />
by these individuals annually, estimates the number <strong>of</strong> these trips potentially taken on public<br />
transit and then, <strong>of</strong> these, the proportion that may require specialized transportation or<br />
additional assistance.<br />
Mean trip rates (Column A in Table 3-13) are the average number <strong>of</strong> one-way trips per day<br />
made by an individual. Mean trip rates are drawn from several published sources.<br />
• The longstanding source is the 2001 National Household Travel Survey (NHTS) which is<br />
routinely used as a basic data set by which to understand travel patterns <strong>of</strong> various<br />
subsets <strong>of</strong> the population. This disaggregated study is built up from a relatively small<br />
“n” but distributed around the country so that it is not geographically limited to a single<br />
region. Because extensive work has been done with this data set, and a similar 1999<br />
study, it is the most common source for daily trip rate activity.<br />
• Through the U.S. DOT Bureau <strong>of</strong> Transportation Statistics, mean trip rates for persons<br />
age 65, for those not employed, and for those with medical conditions limiting travel<br />
were developed and used in Table 3-13.<br />
• Also used is work published by the National Cooperative Highway Research Program<br />
(NCHRD) in a study entitled Estimating Impacts <strong>of</strong> the Aging Population on Transit<br />
Ridership (2006). Considerable research has been done by the highway industry to<br />
49<br />
OCTOBER 2007