San Luis Obispo - Caltrans - State of California
San Luis Obispo - Caltrans - State of California
San Luis Obispo - Caltrans - State of California

Create successful ePaper yourself
Turn your PDF publications into a flip-book with our unique Google optimized e-Paper software.
SAN LUIS OBISPO REGION<br />
COORDINATED HUMAN SERVICES-PUBLIC TRANSPORTATION PLAN<br />
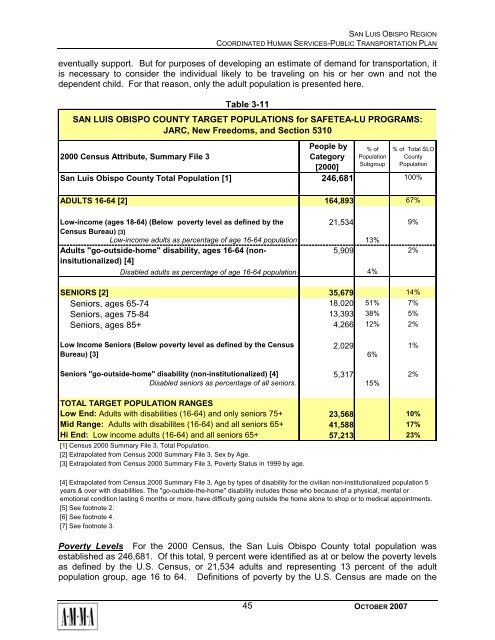
eventually support. But for purposes <strong>of</strong> developing an estimate <strong>of</strong> demand for transportation, it<br />
is necessary to consider the individual likely to be traveling on his or her own and not the<br />
dependent child. For that reason, only the adult population is presented here.<br />
2000 Census Attribute, Summary File 3<br />
Table 3-11<br />
SAN LUIS OBISPO COUNTY TARGET POPULATIONS for SAFETEA-LU PROGRAMS:<br />
JARC, New Freedoms, and Section 5310<br />
People by<br />
Category<br />
[2000]<br />
% <strong>of</strong><br />
Population<br />
Subgroup<br />
% <strong>of</strong> Total SLO<br />
County<br />
Population<br />
<strong>San</strong> <strong>Luis</strong> <strong>Obispo</strong> County Total Population [1] 246,681 100%<br />
ADULTS 16-64 [2] 164,893 67%<br />
Low-income (ages 18-64) (Below poverty level as defined by the<br />
21,534 9%<br />
Census Bureau) [3]<br />
Low-income adults as percentage <strong>of</strong> age 16-64 population 13%<br />
Adults "go-outside-home" disability, ages 16-64 (noninsitutionalized)<br />
5,909 2%<br />
[4]<br />
Disabled adults as percentage <strong>of</strong> age 16-64 population 4%<br />
SENIORS [2] 35,679 14%<br />
Seniors, ages 65-74 18,020 51% 7%<br />
Seniors, ages 75-84 13,393 38% 5%<br />
Seniors, ages 85+ 4,266 12% 2%<br />
Low Income Seniors (Below poverty level as defined by the Census<br />
Bureau) [3]<br />
2,029<br />
6%<br />
1%<br />
Seniors "go-outside-home" disability (non-institutionalized) [4] 5,317<br />
2%<br />
Disabled seniors as percentage <strong>of</strong> all seniors. 15%<br />
TOTAL TARGET POPULATION RANGES<br />
Low End: Adults with disabilities (16-64) and only seniors 75+ 23,568 10%<br />
Mid Range: Adults with disabilites (16-64) and all seniors 65+ 41,588 17%<br />
Hi End: Low income adults (16-64) and all seniors 65+ 57,213 23%<br />
[1] Census 2000 Summary File 3, Total Population.<br />
[2] Extrapolated from Census 2000 Summary File 3, Sex by Age.<br />
[3] Extrapolated from Census 2000 Summary File 3, Poverty Status in 1999 by age.<br />
[4] Extrapolated from Census 2000 Summary File 3, Age by types <strong>of</strong> disability for the civilian non-institutionalized population 5<br />
years & over with disabilities. The "go-outside-the-home" disability includes those who because <strong>of</strong> a physical, mental or<br />
emotional condition lasting 6 months or more, have difficulty going outside the home alone to shop or to medical appointments.<br />
[5] See footnote 2.<br />
[6] See footnote 4.<br />
[7] See footnote 3.<br />
Poverty Levels For the 2000 Census, the <strong>San</strong> <strong>Luis</strong> <strong>Obispo</strong> County total population was<br />
established as 246,681. Of this total, 9 percent were identified as at or below the poverty levels<br />
as defined by the U.S. Census, or 21,534 adults and representing 13 percent <strong>of</strong> the adult<br />
population group, age 16 to 64. Definitions <strong>of</strong> poverty by the U.S. Census are made on the<br />
45<br />
OCTOBER 2007