San Luis Obispo - Caltrans - State of California
San Luis Obispo - Caltrans - State of California
San Luis Obispo - Caltrans - State of California

Create successful ePaper yourself
Turn your PDF publications into a flip-book with our unique Google optimized e-Paper software.
SAN LUIS OBISPO REGION<br />
COORDINATED HUMAN SERVICES-PUBLIC TRANSPORTATION PLAN<br />
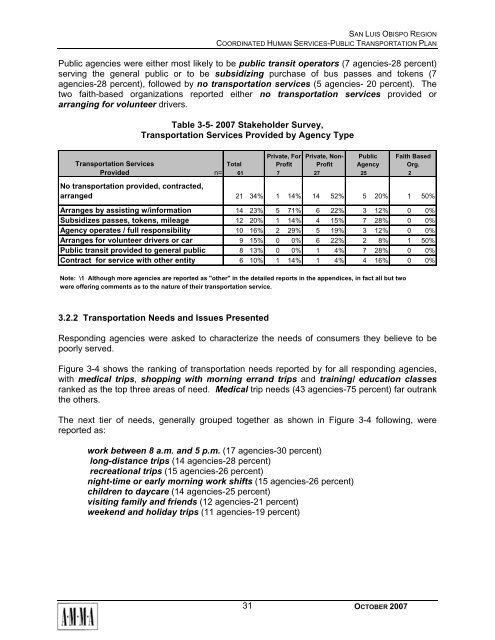
Public agencies were either most likely to be public transit operators (7 agencies-28 percent)<br />
serving the general public or to be subsidizing purchase <strong>of</strong> bus passes and tokens (7<br />
agencies-28 percent), followed by no transportation services (5 agencies- 20 percent). The<br />
two faith-based organizations reported either no transportation services provided or<br />
arranging for volunteer drivers.<br />
Table 3-5- 2007 Stakeholder Survey,<br />
Transportation Services Provided by Agency Type<br />
Transportation Services<br />
Provided<br />
No transportation provided, contracted,<br />
arranged<br />
Private, For Private, Non- Public Faith Based<br />
Total<br />
Pr<strong>of</strong>it Pr<strong>of</strong>it Agency Org.<br />
n= 61 7 27 25 2<br />
21 34% 1 14% 14 52% 5 20% 1 50%<br />
Arranges by assisting w/information 14 23% 5 71% 6 22% 3 12% 0 0%<br />
Subsidizes passes, tokens, mileage 12 20% 1 14% 4 15% 7 28% 0 0%<br />
Agency operates / full responsibility 10 16% 2 29% 5 19% 3 12% 0 0%<br />
Arranges for volunteer drivers or car 9 15% 0 0% 6 22% 2 8% 1 50%<br />
Public transit provided to general public 8 13% 0 0% 1 4% 7 28% 0 0%<br />
Contract for service with other entity 6 10% 1 14% 1 4% 4 16% 0 0%<br />
Note: \1 Although more agencies are reported as "other" in the detailed reports in the appendices, in fact all but two<br />
were <strong>of</strong>fering comments as to the nature <strong>of</strong> their transportation service.<br />
3.2.2 Transportation Needs and Issues Presented<br />
Responding agencies were asked to characterize the needs <strong>of</strong> consumers they believe to be<br />
poorly served.<br />
Figure 3-4 shows the ranking <strong>of</strong> transportation needs reported by for all responding agencies,<br />
with medical trips, shopping with morning errand trips and training/ education classes<br />
ranked as the top three areas <strong>of</strong> need. Medical trip needs (43 agencies-75 percent) far outrank<br />
the others.<br />
The next tier <strong>of</strong> needs, generally grouped together as shown in Figure 3-4 following, were<br />
reported as:<br />
work between 8 a.m. and 5 p.m. (17 agencies-30 percent)<br />
long-distance trips (14 agencies-28 percent)<br />
recreational trips (15 agencies-26 percent)<br />
night-time or early morning work shifts (15 agencies-26 percent)<br />
children to daycare (14 agencies-25 percent)<br />
visiting family and friends (12 agencies-21 percent)<br />
weekend and holiday trips (11 agencies-19 percent)<br />
31<br />
OCTOBER 2007