California State Rail Plan 2005-06 to 2015-16
California State Rail Plan 2005-06 to 2015-16
California State Rail Plan 2005-06 to 2015-16

Create successful ePaper yourself
Turn your PDF publications into a flip-book with our unique Google optimized e-Paper software.
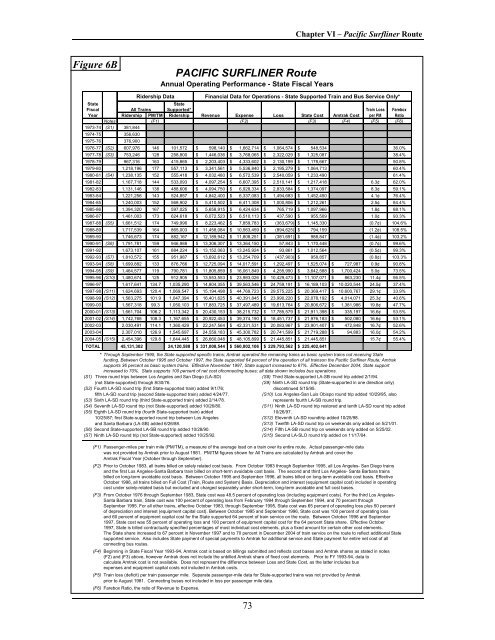
Chapter VI – Pacific Surfliner Route<br />
Figure 6B<br />
Ridership Data<br />
PACIFIC SURFLINER Route<br />
Annual Operating Performance - <strong>State</strong> Fiscal Years<br />
Financial Data for Operations - <strong>State</strong> Supported Train and Bus Service Only*<br />
<strong>State</strong><br />
<strong>State</strong><br />
Fiscal All Trains Supported* Train Loss Farebox<br />
Year Ridership PM/TM Ridership Revenue Expense Loss <strong>State</strong> Cost Amtrak Cost per PM Ratio<br />
Notes (F1) (F2) (F3) (F4) (F5) (F6)<br />
1973-74 (S1) 381,844<br />
1974-75 356,630<br />
1975-76 376,900<br />
1976-77 (S2) 607,976 146 101,572 $ 598,140 $ 1,662,714 $ 1,<strong>06</strong>4,574 $ 548,534<br />
36.0%<br />
1977-78 (S3) 753,246 128 258,800 $ 1,446,036 $ 3,768,<strong>06</strong>5 $ 2,322,029 $ 1,325,087<br />
38.4%<br />
1978-79 967,3<strong>16</strong> <strong>16</strong>3 415,865 $ 2,203,403 $ 4,333,602 $ 2,130,199 $ 1,178,667<br />
50.8%<br />
1979-80 1,218,196 177 557,113 $ 3,341,561 $ 5,536,840 $ 2,195,279 $ 1,<strong>06</strong>4,713<br />
60.4%<br />
1980-81 (S4) 1,238,135 152 555,418 $ 4,032,480 $ 6,572,539 $ 2,540,059 $ 1,233,490<br />
61.4%<br />
1981-82 1,<strong>16</strong>7,718 144 533,093 $ 4,097,254 $ 6,607,395 $ 2,510,141 $ 1,217,418<br />
6.3¢ 62.0%<br />
1982-83 1,131,146 138 488,6<strong>06</strong> $ 4,094,750 $ 6,928,334 $ 2,833,584 $ 1,374,097<br />
8.3¢ 59.1%<br />
1983-84 1,221,256 143 524,857 $ 4,842,400 $ 6,337,083 $ 1,494,683 $ 1,452,450<br />
4.1¢ 76.4%<br />
1984-85 1,240,003 152 568,902 $ 5,410,502 $ 6,411,308 $ 1,000,8<strong>06</strong> $ 1,212,261<br />
2.5¢ 84.4%<br />
1985-86 1,394,320 <strong>16</strong>7 597,025 $ 5,658,915 $ 6,424,634 $ 765,719 $ 1,097,966<br />
1.8¢ 88.1%<br />
1986-87 1,461,003 173 624,618 $ 6,072,523 $ 6,510,113 $ 437,590 $ 955,509<br />
1.0¢ 93.3%<br />
1987-88 (S5) 1,661,512 174 749,996 $ 8,223,462 $ 7,859,783 $ (363,679) $ 1,145,330<br />
(0.7¢) 104.6%<br />
1988-89 1,717,539 <strong>16</strong>4 865,003 $ 11,458,084 $ 10,563,459 $ (894,625) $ 794,159<br />
(1.2¢) 108.5%<br />
1989-90 1,746,673 174 882,<strong>16</strong>7 $ 12,189,942 $ 11,808,251 $ (381,691) $ 988,847<br />
(1.4¢) 103.2%<br />
1990-91 (S6) 1,791,781 159 946,988 $ 13,3<strong>06</strong>,307 $ 13,364,150 $ 57,843 $ 1,170,448<br />
(0.7¢) 99.6%<br />
1991-92 1,673,107 <strong>16</strong>1 884,224 $ 13,152,<strong>06</strong>3 $ 13,245,924 $ 93,861 $ 1,012,564<br />
(0.5¢) 99.3%<br />
1992-93 (S7) 1,810,572 155 951,987 $ 13,692,612 $ 13,254,709 $ (437,903) $ 958,857<br />
(0.8¢) 103.3%<br />
1993-94 (S8) 1,699,882 133 876,766 $ 12,725,094 $ 14,017,591 $ 1,292,497 $ 1,525,074 $ 727,987 0.9¢ 90.8%<br />
1994-95 (S9) 1,464,577 119 790,781 $ 11,805,859 $ <strong>16</strong>,<strong>06</strong>1,849 $ 4,255,990 $ 3,642,588 $ 1,700,424 5.0¢ 73.5%<br />
1995-96 (S10) 1,480,674 125 912,905 $ 13,553,553 $ 23,983,026 $ 10,429,473 $ 11,107,071 $ 863,230 11.4¢ 56.5%<br />
1996-97 1,617,641 134.7 1,035,290 $ 14,804,355 $ 39,563,546 $ 24,759,191 $ <strong>16</strong>,189,103 $ 10,020,544 24.5¢ 37.4%<br />
1997-98 (S11) 1,624,693 120.4 1,<strong>06</strong>9,547 $ 15,194,498 $ 44,769,723 $ 29,575,225 $ 20,369,417 $ 10,600,767 29.1¢ 33.9%<br />
1998-99 (S12) 1,563,275 101.9 1,047,394 $ <strong>16</strong>,401,625 $ 40,391,845 $ 23,990,220 $ 22,078,192 $ 4,014,071 25.3¢ 40.6%<br />
1999-00 1,567,318 99.3 1,050,103 $ 17,883,725 $ 37,497,489 $ 19,613,764 $ 20,8<strong>06</strong>,672 $ 1,381,986 19.8¢ 47.7%<br />
2000-01 (S13) 1,661,704 1<strong>06</strong>.2 1,113,342 $ 20,430,153 $ 38,215,732 $ 17,785,579 $ 21,911,398 $ 335,197 <strong>16</strong>.6¢ 53.5%<br />
2001-02 (S14) 1,742,768 108.3 1,<strong>16</strong>7,655 $ 20,922,453 $ 39,374,190 $ 18,451,737 $ 21,976,183 $ 502,080 <strong>16</strong>.6¢ 53.1%<br />
2002-03 2,030,491 114.1 1,360,429 $ 22,247,564 $ 42,331,531 $ 20,083,967 $ 23,901,407 $ 472,848 <strong>16</strong>.7¢ 52.6%<br />
2003-04 2,307,010 126.9 1,545,697 $ 24,559,183 $ 45,300,782 $ 20,741,599 $ 21,719,288 $ 94,883 <strong>16</strong>.0¢ 54.2%<br />
2004-05 (S15) 2,454,396 129.8 1,644,445 $ 26,660,048 $ 48,105,899 $ 21,445,851 $ 21,445,851<br />
15.7¢ 55.4%<br />
TOTAL 45,131,302 24,120,588 $ 331,008,544 $ 560,802,1<strong>06</strong> $ 229,793,562 $ 225,402,641<br />
* Through September 1995, the <strong>State</strong> supported specific trains; Amtrak operated the remaining trains as basic system trains not receiving <strong>State</strong><br />
funding. Between Oc<strong>to</strong>ber 1995 and Oc<strong>to</strong>ber 1997, the <strong>State</strong> supported 64 percent of the operation of all trainson the Pacific Surfliner Route; Amtrak<br />
supports 36 percent as basic system trains. Effective November 1997, <strong>State</strong> support increased <strong>to</strong> 67%. Effective December 2004, <strong>State</strong> support<br />
increased <strong>to</strong> 70%. <strong>State</strong> supports 100 percent of net cost ofconnecting buses; all data shown includes bus operations.<br />
(S1) Three round trips between Los Angeles and San Diego (LA-SD) (S8) Third <strong>State</strong>-supported LA-SB round trip added 2/1/94.<br />
(not <strong>State</strong>-supported) through 8/30/76.<br />
(S9) Ninth LA-SD round trip (<strong>State</strong>-supported in one direction only)<br />
(S2) Fourth LA-SD round trip (first <strong>State</strong>-supported train) added 9/1/76; discontinued 5/15/95.<br />
fifth LA-SD round trip (second <strong>State</strong>-supported train) added 4/24/77.<br />
(S10) Los Angeles-San Luis Obispo round trip added 10/29/95, also<br />
(S3) Sixth LA-SD round trip (third <strong>State</strong>-supported train) added 2/14/78.<br />
represents fourth LA-SB round trip.<br />
(S4) Seventh LA-SD round trip (not <strong>State</strong>-supported) added 10/26/80.<br />
(S11) Ninth LA-SD round trip res<strong>to</strong>red and tenth LA-SD round trip added<br />
(S5) Eighth LA-SD round trip (fourth <strong>State</strong>-supported train) added 10/26/97.<br />
10/25/87; first <strong>State</strong>-supported round trip between Los Angeles (S12) Eleventh LA-SD roundtrip added 10/25/98.<br />
and Santa Barbara (LA-SB) added 6/26/88. (S13) Twelfth LA-SD round trip on weekends only added on 5/21/01.<br />
(S6) Second <strong>State</strong>-supported LA-SB round trip added 10/28/90. (S14) Fifth LA-SB round trip on weekends only added on 5/25/02.<br />
(S7) Ninth LA-SD round trip (not <strong>State</strong>-supported) added 10/25/92. (S15) Second LA-SLO round trip added on 11/17/04.<br />
(F1) Passenger-miles per train mile (PM/TM), a measure of the average load on a train over its entire route. Actual passenger-mile data<br />
was not provided by Amtrak prior <strong>to</strong> August 1981. PM/TM figures shown for All Trains are calculated by Amtrak and cover the<br />
Amtrak Fiscal Year (Oc<strong>to</strong>ber through September).<br />
(F2) Prior <strong>to</strong> Oc<strong>to</strong>ber 1983, all trains billed on solely related cost basis. From Oc<strong>to</strong>ber 1983 through September 1995, all Los Angeles- San Diego trains<br />
and the first Los Angeles-Santa Barbara train billed on short-term avoidable cost basis. The second and third Los Angeles- Santa Barbara trains<br />
billed on long-term avoidable cost basis. Between Oc<strong>to</strong>ber 1995 and September 1996, all trains billed on long-term avoidable cost basis. Effective<br />
Oc<strong>to</strong>ber 1996, all trains billed on Full Cost (Train, Route and System) Basis. Depreciation and interest (equipment capital cost) included in operating<br />
cost under solely-related basis but excluded and charged separately under short-term, long-term avoidable and full cost bases.<br />
(F3) From Oc<strong>to</strong>ber 1976 through September 1983, <strong>State</strong> cost was 48.5 percent of operating loss (including equipment costs). For the third Los Angeles-<br />
Santa Barbara train, <strong>State</strong> cost was 100 percent of operating loss from February 1994 through September 1994, and 70 percent through<br />
September 1995. For all other trains, effective Oc<strong>to</strong>ber 1983, through September 1995, <strong>State</strong> cost was 65 percent of operating loss plus 50 percent<br />
of depreciation and interest (equipment capital cost). Between Oc<strong>to</strong>ber 1995 and September 1996, <strong>State</strong> cost was 100 percent of operating loss<br />
and 60 percent of equipment capital cost for the <strong>State</strong> supported 64 percent of train service on the route. Between Oc<strong>to</strong>ber 1996 and September<br />
1997, <strong>State</strong> cost was 55 percent of operating loss and 100 percent of equipment capital cost for the 64 percent <strong>State</strong> share. Effective Oc<strong>to</strong>ber<br />
1997, <strong>State</strong> is billed contractually specified percentages of most individual cost elements, plus a fixed amount for certain other cost elements.<br />
The <strong>State</strong> share increased <strong>to</strong> 67 percent in November 1997 and <strong>to</strong> 70 percent in December 2004 of train service on the route <strong>to</strong> reflect additional <strong>State</strong><br />
supported service. Also includes <strong>State</strong> payment of special payments <strong>to</strong> Amtrak for additional service and <strong>State</strong> payment for entire net cost of all<br />
connecting bus routes.<br />
(F4) Beginning in <strong>State</strong> Fiscal Year 1993-94, Amtrak cost is based on billings submitted and reflects cost bases and Amtrak shares as stated in notes<br />
(F2) and (F3) above, however Amtrak does not include the unbilled Amtrak share of fixed cost elements. Prior <strong>to</strong> FY 1993-94, data <strong>to</strong><br />
calculate Amtrak cost is not available. Does not represent the difference between Loss and <strong>State</strong> Cost, as the latter includes bus<br />
expenses and equipment capital costs not included in Amtrak costs.<br />
(F5) Train loss (deficit) per train passenger mile. Separate passenger-mile data for <strong>State</strong>-supported trains was not provided by Amtrak<br />
prior <strong>to</strong> August 1981. Connecting buses not included in loss per passenger mile data.<br />
(F6) Farebox Ratio, the ratio of Revenue <strong>to</strong> Expense.<br />
73