California State Rail Plan 2005-06 to 2015-16
California State Rail Plan 2005-06 to 2015-16
California State Rail Plan 2005-06 to 2015-16
You also want an ePaper? Increase the reach of your titles
YUMPU automatically turns print PDFs into web optimized ePapers that Google loves.
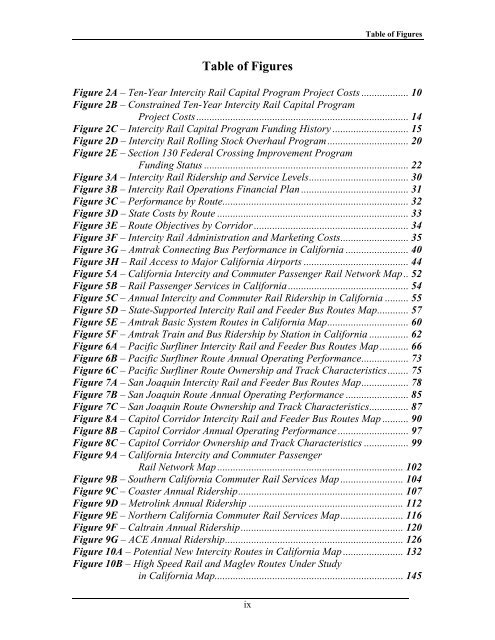
Table of Figures<br />
Table of Figures<br />
Figure 2A – Ten-Year Intercity <strong>Rail</strong> Capital Program Project Costs .................. 10<br />
Figure 2B – Constrained Ten-Year Intercity <strong>Rail</strong> Capital Program<br />
Project Costs................................................................................. 14<br />
Figure 2C – Intercity <strong>Rail</strong> Capital Program Funding His<strong>to</strong>ry ............................. 15<br />
Figure 2D – Intercity <strong>Rail</strong> Rolling S<strong>to</strong>ck Overhaul Program............................... 20<br />
Figure 2E – Section 130 Federal Crossing Improvement Program<br />
Funding Status .............................................................................. 22<br />
Figure 3A – Intercity <strong>Rail</strong> Ridership and Service Levels...................................... 30<br />
Figure 3B – Intercity <strong>Rail</strong> Operations Financial <strong>Plan</strong> ......................................... 31<br />
Figure 3C – Performance by Route....................................................................... 32<br />
Figure 3D – <strong>State</strong> Costs by Route ......................................................................... 33<br />
Figure 3E – Route Objectives by Corridor ........................................................... 34<br />
Figure 3F – Intercity <strong>Rail</strong> Administration and Marketing Costs.......................... 35<br />
Figure 3G – Amtrak Connecting Bus Performance in <strong>California</strong> ........................ 40<br />
Figure 3H – <strong>Rail</strong> Access <strong>to</strong> Major <strong>California</strong> Airports ........................................ 44<br />
Figure 5A – <strong>California</strong> Intercity and Commuter Passenger <strong>Rail</strong> Network Map.. 52<br />
Figure 5B – <strong>Rail</strong> Passenger Services in <strong>California</strong> .............................................. 54<br />
Figure 5C – Annual Intercity and Commuter <strong>Rail</strong> Ridership in <strong>California</strong> ......... 55<br />
Figure 5D – <strong>State</strong>-Supported Intercity <strong>Rail</strong> and Feeder Bus Routes Map............ 57<br />
Figure 5E – Amtrak Basic System Routes in <strong>California</strong> Map............................... 60<br />
Figure 5F – Amtrak Train and Bus Ridership by Station in <strong>California</strong> ............... 62<br />
Figure 6A – Pacific Surfliner Intercity <strong>Rail</strong> and Feeder Bus Routes Map ........... 66<br />
Figure 6B – Pacific Surfliner Route Annual Operating Performance.................. 73<br />
Figure 6C – Pacific Surfliner Route Ownership and Track Characteristics........ 75<br />
Figure 7A – San Joaquin Intercity <strong>Rail</strong> and Feeder Bus Routes Map.................. 78<br />
Figure 7B – San Joaquin Route Annual Operating Performance ........................ 85<br />
Figure 7C – San Joaquin Route Ownership and Track Characteristics............... 87<br />
Figure 8A – Capi<strong>to</strong>l Corridor Intercity <strong>Rail</strong> and Feeder Bus Routes Map .......... 90<br />
Figure 8B – Capi<strong>to</strong>l Corridor Annual Operating Performance ........................... 97<br />
Figure 8C – Capi<strong>to</strong>l Corridor Ownership and Track Characteristics ................. 99<br />
Figure 9A – <strong>California</strong> Intercity and Commuter Passenger<br />
<strong>Rail</strong> Network Map ....................................................................... 102<br />
Figure 9B – Southern <strong>California</strong> Commuter <strong>Rail</strong> Services Map ........................ 104<br />
Figure 9C – Coaster Annual Ridership............................................................... 107<br />
Figure 9D – Metrolink Annual Ridership ........................................................... 112<br />
Figure 9E – Northern <strong>California</strong> Commuter <strong>Rail</strong> Services Map........................ 1<strong>16</strong><br />
Figure 9F – Caltrain Annual Ridership.............................................................. 120<br />
Figure 9G – ACE Annual Ridership.................................................................... 126<br />
Figure 10A – Potential New Intercity Routes in <strong>California</strong> Map ....................... 132<br />
Figure 10B – High Speed <strong>Rail</strong> and Maglev Routes Under Study<br />
in <strong>California</strong> Map........................................................................ 145<br />
ix


