California State Rail Plan 2005-06 to 2015-16
California State Rail Plan 2005-06 to 2015-16
California State Rail Plan 2005-06 to 2015-16
You also want an ePaper? Increase the reach of your titles
YUMPU automatically turns print PDFs into web optimized ePapers that Google loves.
Chapter VII – San Joaquin Route<br />
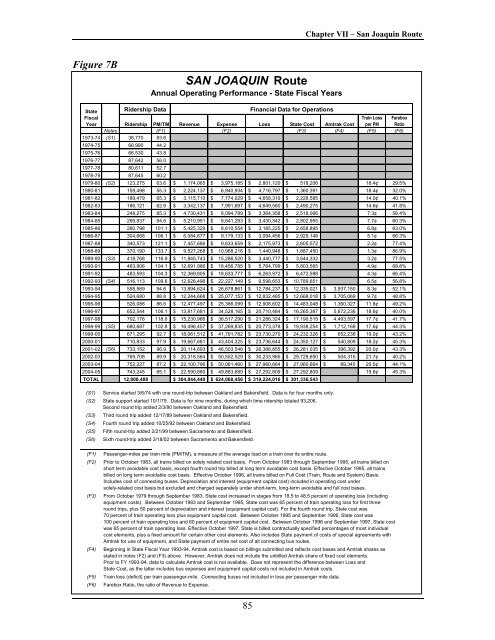
Figure 7B<br />
SAN JOAQUIN Route<br />
Annual Operating Performance - <strong>State</strong> Fiscal Years<br />
<strong>State</strong> Ridership Data Financial Data for Operations<br />
Fiscal Train Loss Farebox<br />
Year Ridership PM/TM Revenue Expense Loss <strong>State</strong> Cost Amtrak Cost per PM Ratio<br />
Notes (F1) (F2) (F3) (F4) (F5) (F6)<br />
1973-74 (S1) 38,770 83.6<br />
1974-75 66,990 44.2<br />
1975-76 66,530 43.8<br />
1976-77 87,642 56.0<br />
1977-78 80,611 52.7<br />
1978-79 87,645 60.2<br />
1979-80 (S2) 123,275 63.6 $ 1,174,<strong>06</strong>5 $ 3,975,185 $ 2,801,120 $ 518,2<strong>06</strong><br />
18.4¢ 29.5%<br />
1980-81 159,498 55.3 $ 2,224,137 $ 6,940,934 $ 4,7<strong>16</strong>,797 $ 1,360,391<br />
18.4¢ 32.0%<br />
1981-82 189,479 65.3 $ 3,115,710 $ 7,774,029 $ 4,658,319 $ 2,228,585<br />
14.0¢ 40.1%<br />
1982-83 186,121 62.9 $ 3,342,137 $ 7,991,697 $ 4,649,560 $ 2,490,275<br />
14.6¢ 41.8%<br />
1983-84 248,275 85.3 $ 4,730,431 $ 8,094,789 $ 3,364,358 $ 2,518,<strong>06</strong>6<br />
7.3¢ 58.4%<br />
1984-85 269,837 94.6 $ 5,210,951 $ 8,641,293 $ 3,430,342 $ 2,802,955<br />
7.7¢ 60.3%<br />
1985-86 280,798 101.1 $ 5,425,329 $ 8,610,554 $ 3,185,225 $ 2,658,895<br />
6.8¢ 63.0%<br />
1986-87 304,668 1<strong>06</strong>.1 $ 6,084,677 $ 9,179,133 $ 3,094,456 $ 2,929,148<br />
5.1¢ 66.3%<br />
1987-88 340,573 121.1 $ 7,457,686 $ 9,633,659 $ 2,175,973 $ 2,605,572<br />
2.2¢ 77.4%<br />
1988-89 370,190 133.7 $ 9,527,268 $ 10,968,2<strong>16</strong> $ 1,440,948 $ 1,887,450<br />
1.3¢ 86.9%<br />
1989-90 (S3) 418,768 1<strong>16</strong>.9 $ 11,845,743 $ 15,286,520 $ 3,440,777 $ 3,544,332<br />
3.2¢ 77.5%<br />
1990-91 463,9<strong>06</strong> 104.1 $ 12,691,986 $ 18,456,785 $ 5,764,799 $ 5,803,565<br />
4.9¢ 68.8%<br />
1991-92 483,593 104.3 $ 12,369,805 $ 18,633,777 $ 6,263,972 $ 6,472,598<br />
4.3¢ 66.4%<br />
1992-93 (S4) 5<strong>16</strong>,113 109.6 $ 12,628,496 $ 22,227,149 $ 9,598,653 $ 10,789,651<br />
6.5¢ 56.8%<br />
1993-94 558,569 94.6 $ 13,894,624 $ 26,678,861 $ 12,784,237 $ 12,335,021 $ 3,937,150 8.3¢ 52.1%<br />
1994-95 524,680 88.8 $ 12,244,668 $ 25,077,153 $ 12,832,485 $ 12,668,018 $ 3,705,<strong>06</strong>9 9.7¢ 48.8%<br />
1995-96 526,088 86.6 $ 12,477,497 $ 25,386,099 $ 12,908,602 $ 14,483,048 $ 1,360,327 11.8¢ 49.2%<br />
1996-97 652,544 1<strong>06</strong>.1 $ 13,817,681 $ 34,528,<strong>16</strong>5 $ 20,710,484 $ <strong>16</strong>,265,387 $ 5,672,236 18.6¢ 40.0%<br />
1997-98 702,178 118.0 $ 15,230,966 $ 36,517,290 $ 21,286,324 $ 17,190,515 $ 4,493,597 17.7¢ 41.7%<br />
1998-99 (S5) 680,687 102.8 $ <strong>16</strong>,496,457 $ 37,269,835 $ 20,773,378 $ 19,938,254 $ 1,712,<strong>16</strong>8 17.6¢ 44.3%<br />
1999-00 671,295 92.7 $ 18,<strong>06</strong>1,512 $ 41,791,782 $ 23,730,270 $ 24,232,326 $ 652,236 19.0¢ 43.2%<br />
2000-01 710,833 97.9 $ 19,667,681 $ 43,404,325 $ 23,736,644 $ 24,350,127 $ 540,809 18.2¢ 45.3%<br />
2001-02 (S6) 733,152 96.9 $ 20,114,693 $ 46,503,548 $ 26,388,855 $ 26,281,035 $ 396,392 20.0¢ 43.3%<br />
2002-03 769,708 89.9 $ 20,318,564 $ 50,552,529 $ 30,233,965 $ 29,729,650 $ 504,315 21.7¢ 40.2%<br />
2003-04 752,227 87.2 $ 22,100,796 $ 50,<strong>06</strong>1,460 $ 27,960,664 $ 27,960,664 $ 89,345 20.5¢ 44.1%<br />
2004-05 743,245 85.1 $ 22,590,880 $ 49,883,689 $ 27,292,809 $ 27,292,809<br />
19.6¢ 45.3%<br />
TOTAL 12,808,488 $ 304,844,440 $ 624,<strong>06</strong>8,456 $ 319,224,0<strong>16</strong> $ 301,336,543<br />
(S1) Service started 3/6/74 with one round-trip between Oakland and Bakersfield. Data is for four months only.<br />
(S2) <strong>State</strong> support started 10/1/79. Data is for nine months, during which time ridership <strong>to</strong>taled 93,2<strong>06</strong>.<br />
Second round trip added 2/3/80 between Oakland and Bakersfield.<br />
(S3) Third round trip added 12/17/89 between Oakland and Bakersfield.<br />
(S4) Fourth round trip added 10/25/92 between Oakland and Bakersfield.<br />
(S5) Fifth round-trip added 2/21/99 between Sacramen<strong>to</strong> and Bakersfield.<br />
(S6) Sixth round-trip added 3/18/02 between Sacramen<strong>to</strong> and Bakersfield.<br />
(F1)<br />
(F2)<br />
(F3)<br />
(F4)<br />
(F5)<br />
(F6)<br />
Passenger-miles per train mile (PM/TM), a measure of the average load on a train over its entire route.<br />
Prior <strong>to</strong> Oc<strong>to</strong>ber 1983, all trains billed on solely related cost basis. From Oc<strong>to</strong>ber 1983 through September 1995, all trains billed on<br />
short term avoidable cost basis, except fourth round trip billed at long term avoidable cost basis. Effective Oc<strong>to</strong>ber 1995, all trains<br />
billed on long term avoidable cost basis. Effective Oc<strong>to</strong>ber 1996, all trains billed on Full Cost (Train, Route and System) Basis.<br />
Includes cost of connecting buses. Depreciation and interest (equipment capital cost) included in operating cost under<br />
solely-related cost basis but excluded and charged separately under short-term, long-term avoidable and full cost bases.<br />
From Oc<strong>to</strong>ber 1979 through September 1983, <strong>State</strong> cost increased in stages from 18.5 <strong>to</strong> 48.5 percent of operating loss (including<br />
equipment costs). Between Oc<strong>to</strong>ber 1983 and September 1995, <strong>State</strong> cost was 65 percent of train operating loss for first three<br />
round trips, plus 50 percent of depreciation and interest (equipment capital cost). For the fourth round trip, <strong>State</strong> cost was<br />
70 percent of train operating loss plus equipment capital cost. Between Oc<strong>to</strong>ber 1995 and September 1996, <strong>State</strong> cost was<br />
100 percent of train operating loss and 60 percent of equipment capital cost. Between Oc<strong>to</strong>ber 1996 and September 1997, <strong>State</strong> cost<br />
was 65 percent of train operating loss. Effective Oc<strong>to</strong>ber 1997, <strong>State</strong> is billed contractually specified percentages of most individual<br />
cost elements, plus a fixed amount for certain other cost elements. Also includes <strong>State</strong> payment of costs of special agreements with<br />
Amtrak for use of equipment, and <strong>State</strong> payment of entire net cost of all connecting bus routes.<br />
Beginning in <strong>State</strong> Fiscal Year 1993-94, Amtrak cost is based on billings submitted and reflects cost bases and Amtrak shares as<br />
stated in notes (F2) and (F3) above. However, Amtrak does not include the unbilled Amtrak share of fixed cost elements.<br />
Prior <strong>to</strong> FY 1993-94, data <strong>to</strong> calculate Amtrak cost is not available. Does not represent the difference between Loss and<br />
<strong>State</strong> Cost, as the latter includes bus expenses and equipment capital costs not included in Amtrak costs.<br />
Train loss (deficit) per train passenger-mile. Connecting buses not included in loss per passenger mile data.<br />
Farebox Ratio, the ratio of Revenue <strong>to</strong> Expense.<br />
85


