California State Rail Plan 2005-06 to 2015-16
California State Rail Plan 2005-06 to 2015-16
California State Rail Plan 2005-06 to 2015-16

You also want an ePaper? Increase the reach of your titles
YUMPU automatically turns print PDFs into web optimized ePapers that Google loves.
Chapter VIII – The Capi<strong>to</strong>l Corridor<br />
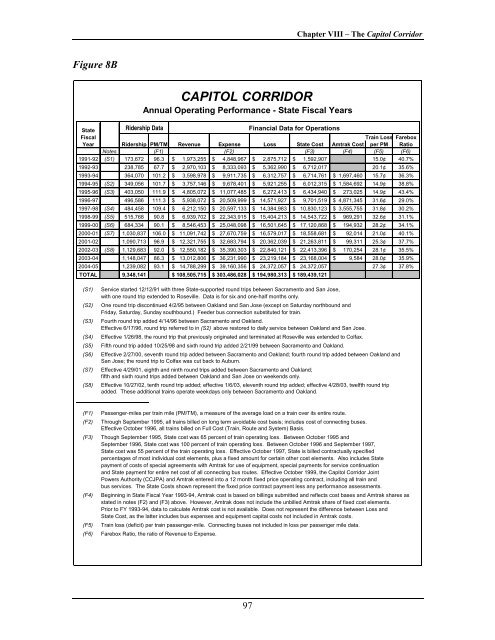
Figure 8B<br />
CAPITOL CORRIDOR<br />
Annual Operating Performance - <strong>State</strong> Fiscal Years<br />
<strong>State</strong> Ridership Data Financial Data for Operations<br />
Fiscal<br />
Train Loss Farebox<br />
Year Ridership PM/TM Revenue Expense Loss <strong>State</strong> Cost Amtrak Cost per PM Ratio<br />
Notes (F1) (F2) (F3) (F4) (F5) (F6)<br />
1991-92 (S1) 173,672 96.3 $ 1,973,255 $ 4,848,967 $ 2,875,712 $ 1,592,907<br />
15.0¢ 40.7%<br />
1992-93 238,785 67.7 $ 2,970,103 $ 8,333,093 $ 5,362,990 $ 6,712,017<br />
20.1¢ 35.6%<br />
1993-94 364,070 101.2 $ 3,598,978 $ 9,911,735 $ 6,312,757 $ 6,714,761 $ 1,697,460 15.7¢ 36.3%<br />
1994-95 (S2) 349,056 101.7 $ 3,757,146 $ 9,678,401 $ 5,921,255 $ 6,012,315 $ 1,584,692 14.9¢ 38.8%<br />
1995-96 (S3) 403,050 111.9 $ 4,805,072 $ 11,077,485 $ 6,272,413 $ 6,434,940 $ 273,025 14.9¢ 43.4%<br />
1996-97 496,586 111.3 $ 5,938,072 $ 20,509,999 $ 14,571,927 $ 9,701,519 $ 4,871,345 31.6¢ 29.0%<br />
1997-98 (S4) 484,458 109.4 $ 6,212,150 $ 20,597,133 $ 14,384,983 $ 10,830,123 $ 3,555,755 31.8¢ 30.2%<br />
1998-99 (S5) 515,768 90.8 $ 6,939,702 $ 22,343,915 $ 15,404,213 $ 14,543,722 $ 969,291 32.6¢ 31.1%<br />
1999-00 (S6) 684,334 90.1 $ 8,546,453 $ 25,048,098 $ <strong>16</strong>,501,645 $ 17,120,868 $ 194,932 28.2¢ 34.1%<br />
2000-01 (S7) 1,030,837 1<strong>06</strong>.0 $ 11,091,742 $ 27,670,759 $ <strong>16</strong>,579,017 $ 18,558,681 $ 92,014 21.0¢ 40.1%<br />
2001-02 1,090,713 96.9 $ 12,321,755 $ 32,683,794 $ 20,362,039 $ 21,263,811 $ 99,311 25.3¢ 37.7%<br />
2002-03 (S8) 1,129,683 92.0 $ 12,550,182 $ 35,390,303 $ 22,840,121 $ 22,413,396 $ 170,254 28.1¢ 35.5%<br />
2003-04 1,148,047 86.3 $ 13,012,8<strong>06</strong> $ 36,231,990 $ 23,219,184 $ 23,<strong>16</strong>8,004 $ 9,584 28.0¢ 35.9%<br />
2004-05 1,239,082 93.1 $ 14,788,299 $ 39,<strong>16</strong>0,356 $ 24,372,057 $ 24,372,057<br />
27.3¢ 37.8%<br />
TOTAL 9,348,141 $ 108,505,715 $ 303,486,028 $ 194,980,313 $ 189,439,121<br />
(S1)<br />
(S2)<br />
(S3)<br />
(S4)<br />
(S5)<br />
(S6)<br />
(S7)<br />
(S8)<br />
Service started 12/12/91 with three <strong>State</strong>-supported round trips between Sacramen<strong>to</strong> and San Jose,<br />
with one round trip extended <strong>to</strong> Roseville. Data is for six and one-half months only.<br />
One round trip discontinued 4/2/95 between Oakland and San Jose (except on Saturday northbound and<br />
Friday, Saturday, Sunday southbound.) Feeder bus connection substituted for train.<br />
Fourth round trip added 4/14/96 between Sacramen<strong>to</strong> and Oakland.<br />
Effective 6/17/96, round trip referred <strong>to</strong> in (S2) above res<strong>to</strong>red <strong>to</strong> daily service between Oakland and San Jose.<br />
Effective 1/26/98, the round trip that previously originated and terminated at Roseville was extended <strong>to</strong> Colfax.<br />
Fifth round trip added 10/25/98 and sixth round trip added 2/21/99 between Sacramen<strong>to</strong> and Oakland.<br />
Effective 2/27/00, seventh round trip added between Sacramen<strong>to</strong> and Oakland; fourth round trip added between Oakland and<br />
San Jose; the round trip <strong>to</strong> Colfax was cut back <strong>to</strong> Auburn.<br />
Effective 4/29/01, eighth and ninth round trips added between Sacramen<strong>to</strong> and Oakland;<br />
fifth and sixth round trips added between Oakland and San Jose on weekends only.<br />
Effective 10/27/02, tenth round trip added; effective 1/6/03, eleventh round trip added; effective 4/28/03, twelfth round trip<br />
added. These additional trains operate weekdays only between Sacramen<strong>to</strong> and Oakland.<br />
(F1)<br />
(F2)<br />
(F3)<br />
(F4)<br />
(F5)<br />
(F6)<br />
Passenger-miles per train mile (PM/TM), a measure of the average load on a train over its entire route.<br />
Through September 1995, all trains billed on long term avoidable cost basis; includes cost of connecting buses.<br />
Effective Oc<strong>to</strong>ber 1996, all trains billed on Full Cost (Train, Route and System) Basis.<br />
Though September 1995, <strong>State</strong> cost was 65 percent of train operating loss. Between Oc<strong>to</strong>ber 1995 and<br />
September 1996, <strong>State</strong> cost was 100 percent of train operating loss. Between Oc<strong>to</strong>ber 1996 and September 1997,<br />
<strong>State</strong> cost was 55 percent of the train operating loss. Effective Oc<strong>to</strong>ber 1997, <strong>State</strong> is billed contractually specified<br />
percentages of most individual cost elements, plus a fixed amount for certain other cost elements. Also includes <strong>State</strong><br />
payment of costs of special agreements with Amtrak for use of equipment, special payments for service continuation<br />
and <strong>State</strong> payment for entire net cost of all connecting bus routes. Effective Oc<strong>to</strong>ber 1999, the Capi<strong>to</strong>l Corridor Joint<br />
Powers Authority (CCJPA) and Amtrak entered in<strong>to</strong> a 12 month fixed price operating contract, including all train and<br />
bus services. The <strong>State</strong> Costs shown represent the fixed price contract payment less any performance assessments.<br />
Beginning in <strong>State</strong> Fiscal Year 1993-94, Amtrak cost is based on billings submitted and reflects cost bases and Amtrak shares as<br />
stated in notes (F2) and (F3) above. However, Amtrak does not include the unbilled Amtrak share of fixed cost elements.<br />
Prior <strong>to</strong> FY 1993-94, data <strong>to</strong> calculate Amtrak cost is not available. Does not represent the difference between Loss and<br />
<strong>State</strong> Cost, as the latter includes bus expenses and equipment capital costs not included in Amtrak costs.<br />
Train loss (deficit) per train passenger-mile. Connecting buses not included in loss per passenger mile data.<br />
Farebox Ratio, the ratio of Revenue <strong>to</strong> Expense.<br />
97