Tsunami MP.11 Installation and Management Model 5012-SUR ...
Tsunami MP.11 Installation and Management Model 5012-SUR ...
Tsunami MP.11 Installation and Management Model 5012-SUR ...

You also want an ePaper? Increase the reach of your titles
YUMPU automatically turns print PDFs into web optimized ePapers that Google loves.
Monitoring <strong>Tsunami</strong> <strong>MP.11</strong> <strong>5012</strong>-<strong>SUR</strong> <strong>Installation</strong> <strong>and</strong> <strong>Management</strong><br />
Spectrum Analyser<br />
Spectrum Analyser<br />
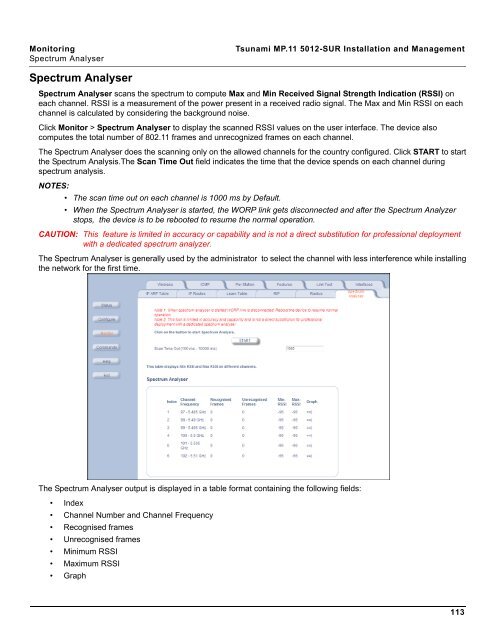
Spectrum Analyser scans the spectrum to compute Max <strong>and</strong> Min Received Signal Strength Indication (RSSI) on<br />
each channel. RSSI is a measurement of the power present in a received radio signal. The Max <strong>and</strong> Min RSSI on each<br />
channel is calculated by considering the background noise.<br />
Click Monitor > Spectrum Analyser to display the scanned RSSI values on the user interface. The device also<br />
computes the total number of 802.11 frames <strong>and</strong> unrecognized frames on each channel.<br />
The Spectrum Analyser does the scanning only on the allowed channels for the country configured. Click START to start<br />
the Spectrum Analysis.The Scan Time Out field indicates the time that the device spends on each channel during<br />
spectrum analysis.<br />
NOTES:<br />
• The scan time out on each channel is 1000 ms by Default.<br />
• When the Spectrum Analyser is started, the WORP link gets disconnected <strong>and</strong> after the Spectrum Analyzer<br />
stops, the device is to be rebooted to resume the normal operation.<br />
CAUTION: This feature is limited in accuracy or capability <strong>and</strong> is not a direct substitution for professional deployment<br />
with a dedicated spectrum analyzer.<br />
The Spectrum Analyser is generally used by the administrator to select the channel with less interference while installing<br />
the network for the first time.<br />
The Spectrum Analyser output is displayed in a table format containing the following fields:<br />
• Index<br />
• Channel Number <strong>and</strong> Channel Frequency<br />
• Recognised frames<br />
• Unrecognised frames<br />
• Minimum RSSI<br />
• Maximum RSSI<br />
• Graph<br />
113