- Page 5 and 6: PREFACEThe Tahoe Regional Planning
- Page 7 and 8: TABLE OF CONTENTSPREFACE...........
- Page 9: 3.5.5 Stormwater Treatment ........
- Page 12 and 13: 6.3 Projects 1 to 5 Acres and all C
- Page 14 and 15: 8.10.5 Maintenance ................
- Page 16 and 17: Table 8-4: Federal, State and Regio
- Page 18 and 19: Figure 4.3-i: Vegetated Swale .....
- Page 20 and 21: INTRODUCTIONPURPOSE AND USERS OF TH
- Page 22 and 23: Lake Tahoe’s world renowned blue
- Page 24 and 25: Urbanization in the Lake Tahoe wate
- Page 26 and 27: 50 percent of the light scattering
- Page 28 and 29: Figure I-c: Impervious Cover versus
- Page 30 and 31: Disconnected impervious areasdrain
- Page 32 and 33: POLLUTANT EFFECT URBAN SOURCES ASSO
- Page 34 and 35: BEST MANAGEMENT PRACTICESHistorical
- Page 36 and 37: Table I-2: Differences in BMP Retro
- Page 38 and 39: CHAPTER 1: URBAN HYDROLOGY1.1 PURPO
- Page 40 and 41: Figure 1-a: Runoff ProcessesTRPA BM
- Page 44 and 45: watersheds to make the necessary es
- Page 46 and 47: Pollutant load estimates are typica
- Page 48 and 49: differ from the following recommend
- Page 50 and 51: Figure 1-b: Hydrologic Processes an
- Page 52 and 53: 1.3.3.2 NRCS BMP CALCULATION SPREAD
- Page 54 and 55: 1.3.3.3 RATIONAL METHODMODEL SUMMAR
- Page 56 and 57: 1.3.3.4 LOAD REDUCTION PLANNING TOO
- Page 58 and 59: in HMS may be event-based or contin
- Page 60 and 61: 1.3.3.6 POLLUTANT LOAD REDUCTION MO
- Page 62 and 63: AVAILABILITY AND SUPPORTING DOCUMEN
- Page 64 and 65: TYPICAL LEVEL OF EFFORTHSPF and LSP
- Page 66 and 67: few days to a week of time to revie
- Page 68 and 69: USACE studies recommended use of th
- Page 70 and 71: during the initial site visit, or c
- Page 72 and 73: Figure 2-a: Soil Horizons• Depth
- Page 74 and 75: Evidence of compacted and disturbed
- Page 76 and 77: UNMAPPED ROCK OUTCROPS, STEEP SLOPE
- Page 78 and 79: The primary pollutants of concern o
- Page 80 and 81: On the map use an arrow to delineat
- Page 82 and 83: 2.2.3 ADDITIONAL DATA GATHERINGAfte
- Page 84 and 85: and allowable uses. Baseline Land C
- Page 86: topographic survey will be required
- Page 89: Table 2-3: Basis of Capability Clas
- Page 92 and 93:
Keep your property lean, clean,and
- Page 94 and 95:
treatment. This will reduce the mai
- Page 96 and 97:
ponds, wetlands, lakes, manmade cha
- Page 98 and 99:
2.3.3.2 SOILS HYDROLOGIC REPORTThe
- Page 100 and 101:
CHAPTER 3: PERMANENT BMP PLANNINGAN
- Page 102 and 103:
STORMWATER TREATMENTRepresents BMPs
- Page 104 and 105:
Table 3-1: Waste Management and Mat
- Page 106 and 107:
D. STABILIZE STEEP DISTURBED SLOPES
- Page 108 and 109:
This infiltration trench collects s
- Page 110 and 111:
3.5 PROJECTS 1 TO 5 ACRES AND ALL C
- Page 112 and 113:
This Page Blank.TRPA BMP HandbookCH
- Page 114 and 115:
unnecessary turf areas and replace
- Page 116 and 117:
Table 3-5: Waste Management and Mat
- Page 118 and 119:
3.5.2.3 SOIL STABILIZATIONA. RESTOR
- Page 120 and 121:
Left: Dripline erosion below a deck
- Page 122 and 123:
Pervious concrete parking pad locat
- Page 124 and 125:
3.5.5 STORMWATER TREATMENT3.5.5.1 M
- Page 126 and 127:
3.6.1.1 JURISDICTIONThese projects
- Page 128 and 129:
to perform required inspection and
- Page 130 and 131:
3.8.2.4 SHARED ACCESS AND EASEMENTS
- Page 132 and 133:
3.8.2.8 STREAM ENVIRONMENT ZONES (S
- Page 134 and 135:
Sediment versus erosion:Suspended s
- Page 136 and 137:
CONTENTSCHAPTER 4: BMP TOOLKIT ....
- Page 138 and 139:
CHAPTER 4: BMP TOOLKIT4.1 HYDROLOGI
- Page 140 and 141:
4.1.1.1 PERVIOUS PAVEMENTAlternativ
- Page 142 and 143:
• Tree canopy overhead can decrea
- Page 144 and 145:
ate determined at the time of insta
- Page 146 and 147:
Figure 4.1-a: Pervious ConcreteTRPA
- Page 148 and 149:
4.1.1.2 INFILTRATION BASINAlternati
- Page 150 and 151:
groundwater, depths to restrictive
- Page 152 and 153:
Very few performance monitoring stu
- Page 154 and 155:
INSPECTION AND MAINTENANCE ACTIVITI
- Page 156 and 157:
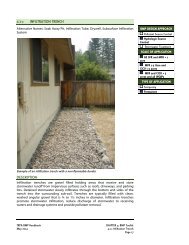
4.1.1.3 INFILTRATION TRENCHAlternat
- Page 158 and 159:
• Consult the NRCS Tahoe Basin So
- Page 160 and 161:
• Alternative Method: Excavate th
- Page 162 and 163:
Figure 4.1-c: Infiltration TrenchTR
- Page 164 and 165:
Figure 4.1-e: Roof Dripline Planter
- Page 166 and 167:
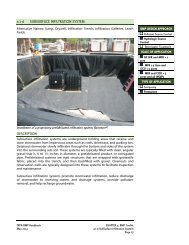
4.1.1.4 SUBSURFACE INFILTRATION SYS
- Page 168:
percent void space compared to 40 p
- Page 171 and 172:
• Ensure the surrounding surface
- Page 174 and 175:
4.1.1.5 RAIN BARREL AND CISTERNAlte
- Page 176 and 177:
• Position the rain barrel or cis
- Page 178 and 179:
4.1.1.6 RAIN GARDENAlternative Name
- Page 180 and 181:
• To manage high flows, design a
- Page 182 and 183:
4.1.1.7 FILTER STRIPAlternative Nam
- Page 184 and 185:
• The top of the vegetated filter
- Page 186 and 187:
INSPECTION AND MAINTENANCE ACTIVITI
- Page 188 and 189:
Figure 4.1-i: Vegetated Filter Stri
- Page 190 and 191:
LIST OF FIGURESFigure 4.2-a: Slope
- Page 192 and 193:
Chapter 4: BMP ToolkitTRPA BMP Hand
- Page 194 and 195:
• Obtain and use a road abrasive
- Page 196 and 197:
Chapter 4: BMP ToolkitTRPA BMP Hand
- Page 198 and 199:
• Mechanical broom sweepers may a
- Page 200 and 201:
EFFECTIVENESS CONSIDERATIONSA signi
- Page 202 and 203:
for dry basins or infiltration basi
- Page 204 and 205:
• For unpaved snow storage areas
- Page 206 and 207:
Figure 4.2-a: Slope Stabilization A
- Page 208 and 209:
Disadvantages• Not always success
- Page 210 and 211:
• Bind together long live branch
- Page 212 and 213:
Brush Layering and MattingBrush lay
- Page 214 and 215:
Chapter 4: BMP ToolkitTRPA BMP Hand
- Page 216 and 217:
Advantages• Reduces the erosion p
- Page 218 and 219:
Table 4.2-1: Terracing Inspection a
- Page 220 and 221:
Chapter 4: BMP ToolkitTRPA BMP Hand
- Page 222 and 223:
Disadvantages• Can be complicated
- Page 224 and 225:
• Revegetate the backfilled bench
- Page 226 and 227:
Figure 4.2-d: Timber Retaining Wall
- Page 228 and 229:
Chapter 4: BMP ToolkitTRPA BMP Hand
- Page 230 and 231:
Advantages• Versatile and applica
- Page 232 and 233:
Table 4.2-3: Riprap Inspection and
- Page 234 and 235:
Chapter 4: BMP ToolkitTRPA BMP Hand
- Page 236 and 237:
educe the concentration of runoff,
- Page 238 and 239:
Figure 4.2-g: Slope Bottom BenchFig
- Page 240 and 241:
• Contour Furrows - relatively de
- Page 242 and 243:
Chapter 4: BMP ToolkitTRPA BMP Hand
- Page 244 and 245:
APPLICABILITYAll roads, driveways,
- Page 246 and 247:
Stormwater runoff from a paved park
- Page 248 and 249:
Figure 4.2-k: Grading for Sheet Flo
- Page 250 and 251:
INORGANIC MULCH:• Areas where org
- Page 252 and 253:
• Stockpile and use existing orga
- Page 254 and 255:
Chapter 4: BMP ToolkitTRPA BMP Hand
- Page 256 and 257:
The surface under the raised decksh
- Page 258 and 259:
Figure 4.2-l: Rock Armor - Elevated
- Page 260 and 261:
Clustered boulders used for parking
- Page 262 and 263:
Chapter 4: BMP ToolkitTRPA BMP Hand
- Page 264 and 265:
Chapter 4: BMP ToolkitTRPA BMP Hand
- Page 266 and 267:
• Helps to protect wildlife.• H
- Page 268 and 269:
EFFECTIVENESS CONSIDERATIONSA prope
- Page 270 and 271:
Improper storage of hazardous mater
- Page 272 and 273:
• Try to use the entire product b
- Page 274 and 275:
Chapter 4: BMP ToolkitTRPA BMP Hand
- Page 276 and 277:
facilities must be equipped with ap
- Page 278 and 279:
Chapter 4: BMP ToolkitTRPA BMP Hand
- Page 280 and 281:
• Dispose of it properly• Be a
- Page 282 and 283:
Chapter 4: BMP ToolkitTRPA BMP Hand
- Page 284 and 285:
Disadvantages• Additional resourc
- Page 286 and 287:
• All hay, cubed hay, straw, mulc
- Page 288 and 289:
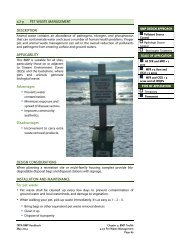
• Sanitary sewer regulations gene
- Page 290 and 291:
APPLICABILITYAll vehicles, includin
- Page 292 and 293:
• Do not perform other vehicle or
- Page 294 and 295:
LIST OF FIGURESFigure 4.3-a: Curb B
- Page 296 and 297:
Chapter 4: BMP ToolkitTRPA BMP Hand
- Page 298 and 299:
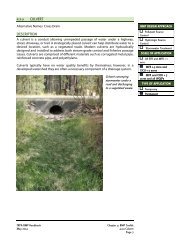
APPLICABILITY• Culverts are appli
- Page 300 and 301:
deterioration. The inspection crew
- Page 302 and 303:
Chapter 4: BMP ToolkitTRPA BMP Hand
- Page 304 and 305:
APPLICABILITY• Curb and gutters a
- Page 306 and 307:
INSTALLATION CONSIDERATIONS• Inst
- Page 308 and 309:
Figure 4.3-b: Rolled CurbChapter 4:
- Page 310 and 311:
Advantages• Prevents the discharg
- Page 312 and 313:
Table 4.3-2: Storm Drain Inspection
- Page 314 and 315:
Advantages• Prevents scour that m
- Page 316 and 317:
Figure 4.3-c: Outlet ProtectionChap
- Page 318 and 319:
Chapter 4: BMP ToolkitTRPA BMP Hand
- Page 320 and 321:
• The structure can be designed t
- Page 322 and 323:
Chapter 4: BMP ToolkitTRPA BMP Hand
- Page 324 and 325:
INSTALLATION CONSIDERATIONS• Disc
- Page 326 and 327:
Chapter 4: BMP ToolkitTRPA BMP Hand
- Page 328 and 329:
Advantages• Assists in the contro
- Page 330 and 331:
Figure 4.3-e: Slotted Channel Drain
- Page 332 and 333:
Advantages• May be less expensive
- Page 334 and 335:
Table 4.3-5: A/C Swale Inspection a
- Page 336 and 337:
Chapter 4: BMP ToolkitTRPA BMP Hand
- Page 338 and 339:
• Prevents property damage, slope
- Page 340 and 341:
Figure 4.3-g: Subsurface DrainChapt
- Page 342 and 343:
abrasives applied during the winter
- Page 344 and 345:
Table 4.3-7: Rock Lined and Vegetat
- Page 346 and 347:
Figure 4.3-i: Vegetated SwaleChapte
- Page 348 and 349:
Check dams installed in water sprea
- Page 350 and 351:
• Design check dams perpendicular
- Page 352 and 353:
CONTENTS4.4 Stormwater Treatment ..
- Page 354 and 355:
4.4 STORMWATER TREATMENTThe primary
- Page 356 and 357:
4.4.1.1 WET BASINAlternative Names:
- Page 358 and 359:
• Surcharge storage above the wet
- Page 360 and 361:
Table 4.4-1: Wet Basin Inspection a
- Page 362 and 363:
Figure 4.4-a: Wet Basin (Concept Dr
- Page 364 and 365:
4.4.1.2 BIOSWALEAlternative Names:
- Page 366 and 367:
• Consider incorporating trees or
- Page 368 and 369:
Figure 4.4-b: Bioswale (Linear Basi
- Page 370 and 371:
4.4.1.3 DRY BASINAlternative Names:
- Page 372 and 373:
• Drainage design standards for t
- Page 374 and 375:
INSPECTION AND MAINTENANCE ACTIVITI
- Page 376 and 377:
Figure 4.4-c: Detention BasinTRPA B
- Page 378 and 379:
4.4.2 FLOW THROUGH TREATMENTFlow-th
- Page 380 and 381:
4.4.2.1 DROP INLET INSERTAlternativ
- Page 382 and 383:
INSTALLATION CONSIDERATIONS• Refe
- Page 384 and 385:
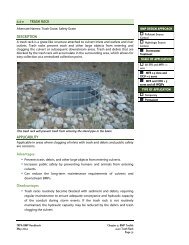
4.4.2.2 TRASH RACKAlternate Names:
- Page 386 and 387:
4.4.2.3 BAFFLED VAULTAlternative Na
- Page 388 and 389:
• Ensure that site conditions all
- Page 390 and 391:
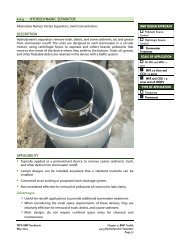
4.4.2.4 HYDRODYNAMIC SEPARATORAlter
- Page 392 and 393:
• Most units are designed to be c
- Page 394 and 395:
4.4.2.5 MEDIA FILTERAlternate Names
- Page 396 and 397:
Cartridge Filter• Cartridge filte
- Page 398 and 399:
• Vent the system as for undergro
- Page 400 and 401:
4.4.2.6 SEDIMENT TRAPAlternative Na
- Page 402 and 403:
INSPECTION AND MAINTENANCE• Regul
- Page 404 and 405:
Figure 4.4-e: Sediment TrapTRPA BMP
- Page 406 and 407:
CONTENTS4.5 Temporary BMPs for Cons
- Page 408 and 409:
4.5 TEMPORARY BMPS FOR CONSTRUCTION
- Page 410 and 411:
concrete washouts and stockpiles sh
- Page 412 and 413:
4.5.1.1 CONSTRUCTION PLANNING AND S
- Page 414 and 415:
• Measures to minimize the potent
- Page 416 and 417:
4.5.1.2 CONSTRUCTION BOUNDARY FENCI
- Page 418 and 419:
Figure 4.5-a: Construction Boundary
- Page 420 and 421:
4.5.1.3 DEWATERINGDESCRIPTIONDewate
- Page 422 and 423:
Figure 4.5-b: DewateringTRPA BMP Ha
- Page 424 and 425:
• Use this settled water to fill
- Page 426 and 427:
4.5.1.4 CLEAN WATER DIVERSIONAltern
- Page 428 and 429:
• Avoid disturbing aquatic specie
- Page 430 and 431:
• Pipe slope drain: A rigid pipe,
- Page 432 and 433:
Stream Isolation Techniques:• Tur
- Page 434 and 435:
Figure 4.5-f: Water DiversionTRPA B
- Page 436 and 437:
4.5.1.5 VEGETATION PROTECTIONAltern
- Page 438 and 439:
• Growing Space: Provide spacing
- Page 440 and 441:
Figure 4.5-g: Vegetation Protection
- Page 442 and 443:
4.5.1.6 TEMPORARY SANITATION FACILI
- Page 444 and 445:
4.5.1.7 DUST CONTROLAlternate Names
- Page 446 and 447:
• Blanket with geotextiles or veg
- Page 448 and 449:
4.5.1.8 VEHICLE INGRESS EGRESS MANA
- Page 450 and 451:
• If possible, re-use swept or va
- Page 452 and 453:
4.5.1.9 WINTERIZATIONDESCRIPTIONBet
- Page 454 and 455:
INSPECTION AND MAINTENANCEEnsure th
- Page 456 and 457:
4.5.1.10 CONSTRUCTION STAGINGAltern
- Page 458 and 459:
4.5.1.11 MATERIAL HANDLING STORAGE
- Page 460 and 461:
• Ensure that current Material Sa
- Page 462 and 463:
4.5.1.12 TOPSOIL SALVAGEAlternative
- Page 464 and 465:
• If topsoil will not be used for
- Page 466 and 467:
4.5.1.13 CONCRETE/BENTONITE MANAGEM
- Page 468 and 469:
Figure 4.5-i: Concrete Washout Stat
- Page 470 and 471:
4.5.1.14 STOCKPILE MANAGEMENTAltern
- Page 472 and 473:
Figure 4.5-j: Stockpile ManagementT
- Page 474 and 475:
4.5.2 EROSION AND SEDIMENT CONTROLR
- Page 476 and 477:
4.5.2.1 SWEEPINGDESCRIPTIONDuring c
- Page 478 and 479:
4.5.2.2 DRAIN INLET PROTECTIONAlter
- Page 480 and 481:
inches. Take care to ensure that no
- Page 482 and 483:
Figure 4.5-k: Drain Inlet Protectio
- Page 484 and 485:
4.5.2.3 FIBER ROLLAlternative Names
- Page 486 and 487:
• Adjust spacing of fiber rolls a
- Page 488 and 489:
Figure 4.5-l: Fiber RollsTRPA BMP H
- Page 490 and 491:
4.5.2.4 SILT FENCEAlternative Names
- Page 492 and 493:
• Turn the fabric uphill at the e
- Page 494 and 495:
Figure 4.5-m: Silt FenceTRPA BMP Ha
- Page 496 and 497:
4.5.2.5 EROSION CONTROL BLANKET SYS
- Page 498 and 499:
structures mark the boundaries of t
- Page 500 and 501:
Figure 4.5-p: Anchoring Geotextiles
- Page 502 and 503:
4.5.2.6 HYDROMULCH, TACKIFIER, AND
- Page 504 and 505:
INSPECTION AND MAINTENANCE• Hydro
- Page 506 and 507:
5.2 SOILSoil is a complex living sy
- Page 508 and 509:
Tilling green wood chips intothe so
- Page 510 and 511:
areas such as SEZs and in shorezone
- Page 512 and 513:
Large boulders provide permanent ve
- Page 514 and 515:
To address this TRPA’s Regional P
- Page 516 and 517:
to apply ½ inch of water. Water yo
- Page 518 and 519:
Pesticides can be degraded by sunli
- Page 520 and 521:
5.3.2.5 FIRE DEFENSIBLE SPACEFire d
- Page 522 and 523:
etween them. For example, shrubs wi
- Page 524 and 525:
5.4 PROJECT SCALE REQUIREMENTSSoil
- Page 526 and 527:
5.4.1.5 PROJECT INSTALLATIONA. CONT
- Page 528 and 529:
percent vegetative cover, soil surf
- Page 531 and 532:
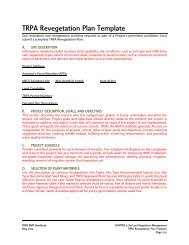
TRPA Revegetation Plan TemplateSoil
- Page 533 and 534:
(c) GRADING AND SLOPE SHAPINGDescri
- Page 535 and 536:
TRPA Revegetation Plan ExampleSoil
- Page 537 and 538:
• All machinery must be clean bef
- Page 539 and 540:
Common NameScientific NameScotchbro
- Page 541 and 542:
during dry weather. All debris, roo
- Page 543 and 544:
substantially different that the pe
- Page 545:
TRPA BMP HandbookCHAPTER 5: Soil an
- Page 548 and 549:
Fertilizer Management PlanProject N
- Page 550 and 551:
IV. MONITORINGSurface and groundwat
- Page 552 and 553:
I. PROJECT AND SITE DESCRIPTIONGold
- Page 555:
Table 5-1: Description of Revegetat
- Page 558 and 559:
SITE TYPE RECOMMENDED SPECIES LISTS
- Page 560 and 561:
SITE TYPE RECOMMENDED SPECIES LISTW
- Page 562 and 563:
CHAPTER 5: Soil and Vegetation Mana
- Page 564 and 565:
TRPA APPROVED PLANT SPECIES ATTRIBU
- Page 566 and 567:
TRPA APPROVED PLANT SPECIES ATTRIBU
- Page 568 and 569:
CHAPTER 5: Soil and Vegetation Mana
- Page 570 and 571:
• Section 6.2 describes methods f
- Page 572 and 573:
equirements. At a minimum, training
- Page 574 and 575:
Vactor equipment removes sediment a
- Page 576 and 577:
Industrial Properties, Marinas, and
- Page 578 and 579:
• Rinse the rock with hose water
- Page 580 and 581:
EXAMPLE INSPECTION AND MAINTENANCE
- Page 582 and 583:
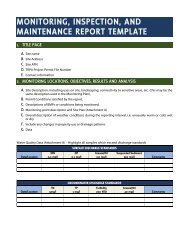
MONITORING PLAN TEMPLATE1. TITLE PA
- Page 584 and 585:
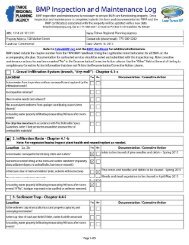
MONITORING, INSPECTION, ANDMAINTENA
- Page 586 and 587:
Sample Site123 Main StreetSouth Lak
- Page 588 and 589:
3. MONITORINGIn 2011, South Lake Ta
- Page 590 and 591:
ATTACHMENT BWATER QUALITY DATA
- Page 592 and 593:
ATTACHMENT DINSPECTION AND MAINTENC
- Page 594 and 595:
• Discharge of stormwater from in
- Page 596 and 597:
PAVING SINGLE FAMILY RESIDENTIAL PR
- Page 598 and 599:
TRPA Shorezone permit (www.trpa.org
- Page 600 and 601:
CHAPTER 8: SHOREZONE PROTECTIVESTRU
- Page 602 and 603:
technical guidance on structural an
- Page 604 and 605:
Pope has developed a shorezone miti
- Page 606 and 607:
ADVANTAGES• Protect parcel develo
- Page 608 and 609:
Table 8-3: Categorical Classificati
- Page 610 and 611:
generate observable changes in the
- Page 612 and 613:
Table 8-5: The General Geomorphic C
- Page 614 and 615:
8.1.8.2 TOLERANCE DISTRICT AND BACK
- Page 616 and 617:
Figure 8-e: Option 2—Backshore De
- Page 618 and 619:
Scenic Resources and project compli
- Page 620 and 621:
8.2 BULKHEADS AND LAKE WALLS8.2.1 O
- Page 622 and 623:
oth the beach immediately fronting
- Page 624 and 625:
Like all BMPs, bulkheads and lake w
- Page 626 and 627:
For a bulkhead located such that th
- Page 628 and 629:
Figure 8-i: Typical Lake Wall (Grav
- Page 630 and 631:
Table 8-9: Advantages and Disadvant
- Page 632 and 633:
maintains its position under wave s
- Page 634 and 635:
8.3.4 INSTALLATIONAs with bulkheads
- Page 636 and 637:
Table 8-11: Advantages and Disadvan
- Page 638 and 639:
V t ≥ 5R c2(Equation 4.1)Where:Vt
- Page 640 and 641:
8.5 BEACH NOURISHMENT AND REPLENISH
- Page 642 and 643:
of not being able to protect the ba
- Page 644 and 645:
• The material must be washed to
- Page 646 and 647:
nourishment will be determined by m
- Page 648 and 649:
Table 8-14: Advantages and Disadvan
- Page 650 and 651:
8.7 BREAKWATERS8.7.1 OVERVIEWBreakw
- Page 652 and 653:
The procedure for determining armor
- Page 654 and 655:
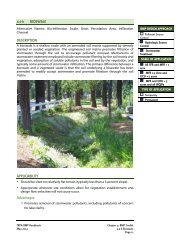
8.8 SHOREZONE VEGETATION8.8.1 OVERV
- Page 656 and 657:
vegetation. Protecting a tree from
- Page 658 and 659:
Overall, dredging can be either a p
- Page 660 and 661:
The Pneuma pump is a piece of dredg
- Page 662 and 663:
nature of the project and the poten
- Page 664 and 665:
8.10 TURBIDITY CURTAINS8.10.1 OVERV
- Page 666 and 667:
weights or connected firmly to sand
- Page 668 and 669:
Figure 8-o: Turbidity Curtain Desig
- Page 670 and 671:
Aquatic invasive species (AIS) also
- Page 672 and 673:
tanks into a sewage retention and/o
- Page 674 and 675:
• A common problem with recreatio
- Page 676 and 677:
8.12 BOAT RAMP CONSTRUCTION AND VEH
- Page 678 and 679:
Table 8-20: Advantages and Disadvan
- Page 680 and 681:
amp at the change of grade. A V-gro
- Page 682 and 683:
Figure 8-p: Boat Ramp DesignTRPA BM
- Page 684 and 685:
Table 8-22: Overview of Geotechnica
- Page 686 and 687:
8.14 SHOREZONE PROTECTIVE STRUCTURE
- Page 688 and 689:
8.14.2 ADDITIONAL CONSIDERATIONS FO
- Page 690 and 691:
some designated boundary or sphere
- Page 692 and 693:
spawning grounds and juvenile nurse
- Page 694 and 695:
Marine Science, School of Geoscienc
- Page 696 and 697:
Osborne, R.H., et. Al. (1985). Sedi
- Page 698 and 699:
8.16 APPENDICES8.16.1 DESIGN CALCUL
- Page 700 and 701:
Figure 8-r defines the primary wave
- Page 702 and 703:
8.16.1.2 WAVE RUN-UP FORMULA FOR BA
- Page 704 and 705:
• Use Equation 16.10 to calculate
- Page 706 and 707:
Figure 8-u: Design Wave CasesTRPA B
- Page 708 and 709:
Figure 8-v: Wave Setup and Run-Up f
- Page 710 and 711:
Alternative methods of wave calcula
- Page 712 and 713:
GLOSSARYAccretionMay be either a na
- Page 714 and 715:
eaches have no berm, others have se
- Page 716 and 717:
DensityMass (in kg) per unit of vol
- Page 718 and 719:
Fire Defensible SpaceRefers to the
- Page 720 and 721:
Common terms related to land covera
- Page 722 and 723:
PermeabilityThe property of a bulk
- Page 724 and 725:
ScourRemoval of underwater material
- Page 726 and 727:
SlopeThe degree of inclination to t
- Page 728 and 729:
Technical Advisory Committee (TAC)C
- Page 730 and 731:
ACRONYMSACES - Automated Coastal En
- Page 732 and 733:
NPS - Nonpoint SourceNRCS - Natural