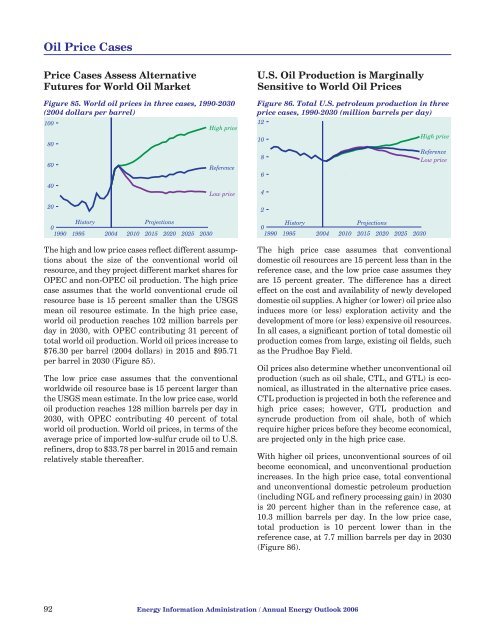
Oil Price CasesPrice Cases Assess AlternativeFutures for World Oil MarketFigure 85. World oil prices in three cases, 1990-<strong>2030</strong>(2004 dollars per barrel)10080604020His<strong>to</strong>ry<strong>Projections</strong>01990 1995 2004 2010 2015 2020 2025 <strong>2030</strong>High priceReferenceLow priceThe high and low price cases reflect different assumptionsabout the size of the conventional world oilresource, and they project different market shares forOPEC and non-OPEC oil production. The high pricecase assumes that the world conventional crude oilresource base is 15 percent smaller than the USGSmean oil resource estimate. In the high price case,world oil production reaches 102 million barrels perday in <strong>2030</strong>, <strong>with</strong> OPEC contributing 31 percent of<strong>to</strong>tal world oil production. World oil prices increase <strong>to</strong>$76.30 per barrel (2004 dollars) in 2015 and $95.71per barrel in <strong>2030</strong> (Figure 85).The low price case assumes that the conventionalworldwide oil resource base is 15 percent larger thanthe USGS mean estimate. In the low price case, worldoil production reaches 128 million barrels per day in<strong>2030</strong>, <strong>with</strong> OPEC contributing 40 percent of <strong>to</strong>talworld oil production. World oil prices, in terms of theaverage price of imported low-sulfur crude oil <strong>to</strong> U.S.refiners, drop <strong>to</strong> $33.78 per barrel in 2015 and remainrelatively stable thereafter.U.S. Oil Production is MarginallySensitive <strong>to</strong> World Oil PricesFigure 86. Total U.S. petroleum production in threeprice cases, 1990-<strong>2030</strong> (million barrels per day)12108642His<strong>to</strong>ry<strong>Projections</strong>01990 1995 2004 2010 2015 2020 2025 <strong>2030</strong>High priceReferenceLow priceThe high price case assumes that conventionaldomestic oil resources are 15 percent less than in thereference case, and the low price case assumes theyare 15 percent greater. The difference has a directeffect on the cost and availability of newly developeddomestic oil supplies. A higher (or lower) oil price alsoinduces more (or less) exploration activity and thedevelopment of more (or less) expensive oil resources.In all cases, a significant portion of <strong>to</strong>tal domestic oilproduction comes from large, existing oil fields, suchas the Prudhoe Bay Field.Oil prices also determine whether unconventional oilproduction (such as oil shale, CTL, and GTL) is economical,as illustrated in the alternative price cases.CTL production is projected in both the reference andhigh price cases; however, GTL production andsyncrude production from oil shale, both of whichrequire higher prices before they become economical,are projected only in the high price case.With higher oil prices, unconventional sources of oilbecome economical, and unconventional productionincreases. In the high price case, <strong>to</strong>tal conventionaland unconventional domestic petroleum production(including NGL and refinery processing gain) in <strong>2030</strong>is 20 percent higher than in the reference case, at10.3 million barrels per day. In the low price case,<strong>to</strong>tal production is 10 percent lower than in thereference case, at 7.7 million barrels per day in <strong>2030</strong>(Figure 86).92 <strong>Energy</strong> Information Administration / <strong>Annual</strong> <strong>Energy</strong> <strong>Outlook</strong> <strong>2006</strong>
Oil Price and Technology CasesU.S. Syncrude Production FromOil Shale Requires Higher Oil PricesFigure 87. U.S. syncrude production from oil shalein the high price case, 2004-<strong>2030</strong>(thousand barrels per day)500More Rapid Technology AdvancesCould Raise U.S. Oil ProductionFigure 88. Total U.S. crude oil productionin three technology cases, 1990-<strong>2030</strong>(million barrels per day)104008300<strong>2006</strong>4Rapid technologyReferenceSlow technology100202004 2010 2015 2020 2025 <strong>2030</strong>In the United States, the commercial viability ofsyncrude produced from oil shale largely depends onoil prices. Although the production costs for oil shalesyncrude decline through <strong>2030</strong> in all cases, it becomeseconomical only in the high price case, <strong>with</strong> productionstarting in 2019 and increasing <strong>to</strong> 405,000 barrelsper day in <strong>2030</strong>, when it represents 4 percent ofU.S. petroleum production, including NGL and refineryprocessing gain (Figure 87).Production costs for oil shale syncrude are highlyuncertain. Development of this domestic resourcecame <strong>to</strong> a halt in the mid-1980s, during a period of lowoil prices. The cost assumptions used in developingthe projections represent an oil shale industrybased on underground mining and surface re<strong>to</strong>rting;however, the development of a true in situ re<strong>to</strong>rtingtechnology could substantially reduce the cost of producingoil shale syncrude.The development of U.S. oil shale resources is alsouncertain from an environmental perspective. Oilshale costs will remain highly uncertain until thepetroleum industry builds a demonstration project.An oil shale industry based on underground miningand surface re<strong>to</strong>rting could face considerable publicopposition because of its potential environmentalimpacts, involving scenic vistas, waste rock disposaland remediation, and water availability and contamination.Consequently, there is a high level ofuncertainty in the projection for oil shale syncrudeproduction in the high price case.His<strong>to</strong>ry<strong>Projections</strong>01990 1995 2004 2010 2015 2020 2025 <strong>2030</strong>The rapid and slow oil and gas technology casesassume rates of technological progress in the petroleumindustry that are 50 percent higher and 50 percentlower, respectively, than the his<strong>to</strong>rical rate. Therate of technological progress determines the cost ofdeveloping and producing the remaining domestic oilresource base. Higher (or lower) rates of technologicalprogress result in lower (or higher) oil developmentand production costs, which in turn allow more (orless) oil production.With domestic oil consumption determined largely byoil prices and economic growth rates, oil consumptiondoes not change significantly in the technology cases.Domestic crude oil production in <strong>2030</strong>, which is4.6 million barrels per day in the reference case,increases <strong>to</strong> 4.9 million barrels per day in the rapidtechnology case and drops <strong>to</strong> 4.2 million barrels perday in the slow technology case (Figure 88). The projectedchanges in domestic oil production result indifferent projections for petroleum imports. In <strong>2030</strong>,projected net crude oil and petroleum productimports range from 16.7 million barrels per day in therapid technology case <strong>to</strong> 17.7 million barrels per dayin the slow technology case, as compared <strong>with</strong> 17.2million barrels per day in the reference case. U.S.dependence on petroleum imports in <strong>2030</strong> rangesfrom 61 percent in the rapid technology case <strong>to</strong> 64percent in the slow technology case.Cumulatively, from 2004 through <strong>2030</strong>, U.S. <strong>to</strong>talcrude oil production is projected <strong>to</strong> be 1.9 billion barrels(3.8 percent) higher in the rapid technology caseand 2.1 billion barrels (4.1 percent) lower in the slowtechnology case than in the reference case.<strong>Energy</strong> Information Administration / <strong>Annual</strong> <strong>Energy</strong> <strong>Outlook</strong> <strong>2006</strong> 93