

Annual Energy Outlook 2006 with Projections to 2030 - Usinfo.org
Annual Energy Outlook 2006 with Projections to 2030 - Usinfo.org
Annual Energy Outlook 2006 with Projections to 2030 - Usinfo.org

Create successful ePaper yourself
Turn your PDF publications into a flip-book with our unique Google optimized e-Paper software.
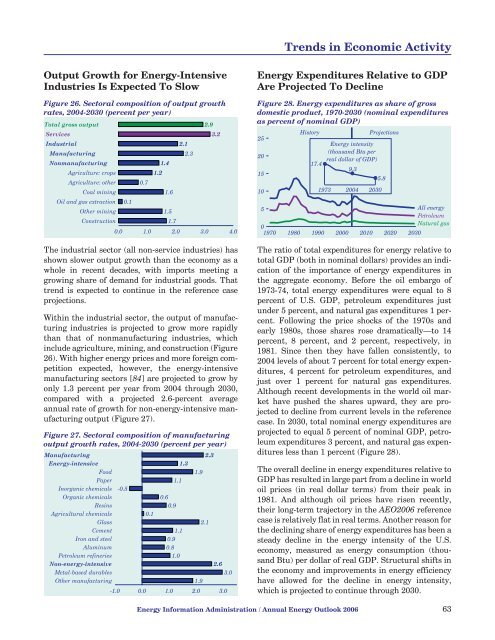
Trends in Economic ActivityOutput Growth for <strong>Energy</strong>-IntensiveIndustries Is Expected To Slow<strong>Energy</strong> Expenditures Relative <strong>to</strong> GDPAre Projected To DeclineFigure 26. Sec<strong>to</strong>ral composition of output growthrates, 2004-<strong>2030</strong> (percent per year)Figure 28. <strong>Energy</strong> expenditures as share of grossdomestic product, 1970-<strong>2030</strong> (nominal expendituresas percent of nominal GDP)Total gross output2.9Services3.2His<strong>to</strong>ry<strong>Projections</strong>25Industrial2.1<strong>Energy</strong> intensityManufacturing2.3(thousand Btu per20real dollar of GDP)Nonmanufacturing1.417.49.3Agriculture: crops1.2155.8Agriculture: other 0.7Coal mining1.6101973 2004 <strong>2030</strong>Oil and gas extraction 0.1Other mining1.55All energyPetroleumConstruction1.7Natural gas00.0 1.0 2.0 3.0 4.0 1970 1980 1990 2000 2010 2020 <strong>2030</strong>The industrial sec<strong>to</strong>r (all non-service industries) hasshown slower output growth than the economy as awhole in recent decades, <strong>with</strong> imports meeting agrowing share of demand for industrial goods. Thattrend is expected <strong>to</strong> continue in the reference caseprojections.Within the industrial sec<strong>to</strong>r, the output of manufacturingindustries is projected <strong>to</strong> grow more rapidlythan that of nonmanufacturing industries, whichinclude agriculture, mining, and construction (Figure26). With higher energy prices and more foreign competitionexpected, however, the energy-intensivemanufacturing sec<strong>to</strong>rs [84] are projected <strong>to</strong> grow byonly 1.3 percent per year from 2004 through <strong>2030</strong>,compared <strong>with</strong> a projected 2.6-percent averageannual rate of growth for non-energy-intensive manufacturingoutput (Figure 27).Figure 27. Sec<strong>to</strong>ral composition of manufacturingoutput growth rates, 2004-<strong>2030</strong> (percent per year)Manufacturing<strong>Energy</strong>-intensiveFoodPaperIn<strong>org</strong>anic chemicalsOrganic chemicalsResinsAgricultural chemicalsGlassCementIron and steelAluminumPetroleum refineriesNon-energy-intensiveMetal-based durablesOther manufacturing-1.0-0.51.11.31.92.30.60.90.12.11.10.90.81.02.63.01.90.0 1.0 2.0 3.0The ratio of <strong>to</strong>tal expenditures for energy relative <strong>to</strong><strong>to</strong>tal GDP (both in nominal dollars) provides an indicationof the importance of energy expenditures inthe aggregate economy. Before the oil embargo of1973-74, <strong>to</strong>tal energy expenditures were equal <strong>to</strong> 8percent of U.S. GDP, petroleum expenditures justunder 5 percent, and natural gas expenditures 1 percent.Following the price shocks of the 1970s andearly 1980s, those shares rose dramatically—<strong>to</strong> 14percent, 8 percent, and 2 percent, respectively, in1981. Since then they have fallen consistently, <strong>to</strong>2004 levels of about 7 percent for <strong>to</strong>tal energy expenditures,4 percent for petroleum expenditures, andjust over 1 percent for natural gas expenditures.Although recent developments in the world oil markethave pushed the shares upward, they are projected<strong>to</strong> decline from current levels in the referencecase. In <strong>2030</strong>, <strong>to</strong>tal nominal energy expenditures areprojected <strong>to</strong> equal 5 percent of nominal GDP, petroleumexpenditures 3 percent, and natural gas expendituresless than 1 percent (Figure 28).The overall decline in energy expenditures relative <strong>to</strong>GDP has resulted in large part from a decline in worldoil prices (in real dollar terms) from their peak in1981. And although oil prices have risen recently,their long-term trajec<strong>to</strong>ry in the AEO<strong>2006</strong> referencecase is relatively flat in real terms. Another reason forthe declining share of energy expenditures has been asteady decline in the energy intensity of the U.S.economy, measured as energy consumption (thousandBtu) per dollar of real GDP. Structural shifts inthe economy and improvements in energy efficiencyhave allowed for the decline in energy intensity,which is projected <strong>to</strong> continue through <strong>2030</strong>.<strong>Energy</strong> Information Administration / <strong>Annual</strong> <strong>Energy</strong> <strong>Outlook</strong> <strong>2006</strong> 63


