

Annual Energy Outlook 2006 with Projections to 2030 - Usinfo.org
Annual Energy Outlook 2006 with Projections to 2030 - Usinfo.org
Annual Energy Outlook 2006 with Projections to 2030 - Usinfo.org

Create successful ePaper yourself
Turn your PDF publications into a flip-book with our unique Google optimized e-Paper software.
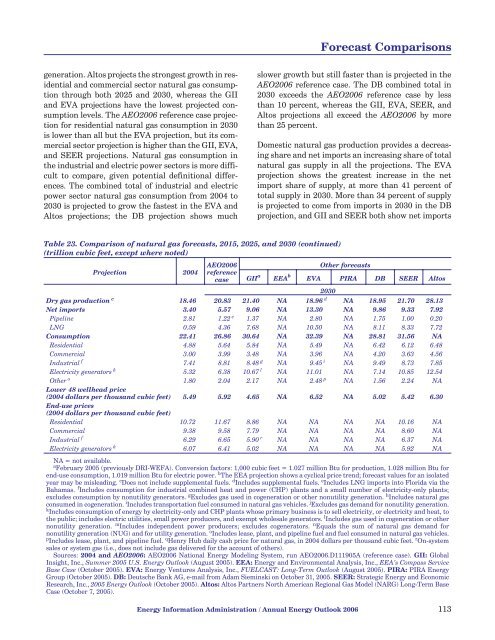
Forecast Comparisonsgeneration. Al<strong>to</strong>s projects the strongest growth in residentialand commercial sec<strong>to</strong>r natural gas consumptionthrough both 2025 and <strong>2030</strong>, whereas the GIIand EVA projections have the lowest projected consumptionlevels. The AEO<strong>2006</strong> reference case projectionfor residential natural gas consumption in <strong>2030</strong>is lower than all but the EVA projection, but its commercialsec<strong>to</strong>r projection is higher than the GII, EVA,and SEER projections. Natural gas consumption inthe industrial and electric power sec<strong>to</strong>rs is more difficult<strong>to</strong> compare, given potential definitional differences.The combined <strong>to</strong>tal of industrial and electricpower sec<strong>to</strong>r natural gas consumption from 2004 <strong>to</strong><strong>2030</strong> is projected <strong>to</strong> grow the fastest in the EVA andAl<strong>to</strong>s projections; the DB projection shows muchslower growth but still faster than is projected in theAEO<strong>2006</strong> reference case. The DB combined <strong>to</strong>tal in<strong>2030</strong> exceeds the AEO<strong>2006</strong> reference case by lessthan 10 percent, whereas the GII, EVA, SEER, andAl<strong>to</strong>s projections all exceed the AEO<strong>2006</strong> by morethan 25 percent.Domestic natural gas production provides a decreasingshare and net imports an increasing share of <strong>to</strong>talnatural gas supply in all the projections. The EVAprojection shows the greatest increase in the netimport share of supply, at more than 41 percent of<strong>to</strong>tal supply in <strong>2030</strong>. More than 34 percent of supplyis projected <strong>to</strong> come from imports in <strong>2030</strong> in the DBprojection, and GII and SEER both show net importsTable 23. Comparison of natural gas forecasts, 2015, 2025, and <strong>2030</strong> (continued)(trillion cubic feet, except where noted)Projection 2004AEO<strong>2006</strong>referencecaseOther forecastsGII a EEA b EVA PIRA DB SEER Al<strong>to</strong>s<strong>2030</strong>Dry gas production c 18.46 20.83 21.40 NA 18.96 d NA 18.95 21.70 28.13Net imports 3.40 5.57 9.06 NA 13.30 NA 9.86 9.33 7.92Pipeline 2.81 1.22 e 1.37 NA 2.80 NA 1.75 1.00 0.20LNG 0.59 4.36 7.68 NA 10.50 NA 8.11 8.33 7.72Consumption 22.41 26.86 30.64 NA 32.39 NA 28.81 31.56 NAResidential 4.88 5.64 5.84 NA 5.49 NA 6.42 6.12 6.48Commercial 3.00 3.99 3.48 NA 3.96 NA 4.20 3.63 4.56Industrial f 7.41 8.81 8.48 g NA 9.45 i NA 9.49 8.73 7.85Electricity genera<strong>to</strong>rs k 5.32 6.38 10.67 l NA 11.01 NA 7.14 10.85 12.54Other o 1.80 2.04 2.17 NA 2.48 p NA 1.56 2.24 NALower 48 wellhead price(2004 dollars per thousand cubic feet) 5.49 5.92 4.65 NA 6.52 NA 5.02 5.42 6.30End-use prices(2004 dollars per thousand cubic feet)Residential 10.72 11.67 8.86 NA NA NA NA 10.16 NACommercial 9.38 9.58 7.79 NA NA NA NA 8.60 NAIndustrial f 6.29 6.65 5.90 r NA NA NA NA 6.37 NAElectricity genera<strong>to</strong>rs k 6.07 6.41 5.02 NA NA NA NA 5.92 NANA = not available.a February 2005 (previously DRI-WEFA). Conversion fac<strong>to</strong>rs: 1,000 cubic feet = 1.027 million Btu for production, 1.028 million Btu forend-use consumption, 1.019 million Btu for electric power. b The EEA projection shows a cyclical price trend; forecast values for an isolatedyear may be misleading. c Does not include supplemental fuels. d Includes supplemental fuels. e Includes LNG imports in<strong>to</strong> Florida via theBahamas. f Includes consumption for industrial combined heat and power (CHP) plants and a small number of electricity-only plants;excludes consumption by nonutility genera<strong>to</strong>rs. g Excludes gas used in cogeneration or other nonutility generation. h Includes natural gasconsumed in cogeneration. i Includes transportation fuel consumed in natural gas vehicles. j Excludes gas demand for nonutility generation.k Includes consumption of energy by electricity-only and CHP plants whose primary business is <strong>to</strong> sell electricity, or electricity and heat, <strong>to</strong>the public; includes electric utilities, small power producers, and exempt wholesale genera<strong>to</strong>rs. l Includes gas used in cogeneration or othernonutility generation. m Includes independent power producers; excludes cogenera<strong>to</strong>rs. n Equals the sum of natural gas demand fornonutility generation (NUG) and for utility generation. o Includes lease, plant, and pipeline fuel and fuel consumed in natural gas vehicles.p Includes lease, plant, and pipeline fuel. q Henry Hub daily cash price for natural gas, in 2004 dollars per thousand cubic feet. r On-systemsales or system gas (i.e., does not include gas delivered for the account of others).Sources: 2004 and AEO<strong>2006</strong>: AEO<strong>2006</strong> National <strong>Energy</strong> Modeling System, run AEO<strong>2006</strong>.D111905A (reference case). GII: GlobalInsight, Inc., Summer 2005 U.S. <strong>Energy</strong> <strong>Outlook</strong> (August 2005). EEA: <strong>Energy</strong> and Environmental Analysis, Inc., EEA’s Compass ServiceBase Case (Oc<strong>to</strong>ber 2005). EVA: <strong>Energy</strong> Ventures Analysis, Inc., FUELCAST: Long-Term <strong>Outlook</strong> (August 2005). PIRA: PIRA <strong>Energy</strong>Group (Oc<strong>to</strong>ber 2005). DB: Deutsche Bank AG, e-mail from Adam Sieminski on Oc<strong>to</strong>ber 31, 2005. SEER: Strategic <strong>Energy</strong> and EconomicResearch, Inc., 2005 <strong>Energy</strong> <strong>Outlook</strong> (Oc<strong>to</strong>ber 2005). Al<strong>to</strong>s: Al<strong>to</strong>s Partners North American Regional Gas Model (NARG) Long-Term BaseCase (Oc<strong>to</strong>ber 7, 2005).<strong>Energy</strong> Information Administration / <strong>Annual</strong> <strong>Energy</strong> <strong>Outlook</strong> <strong>2006</strong> 113


