Annual Energy Outlook 2006 with Projections to 2030 - Usinfo.org
Annual Energy Outlook 2006 with Projections to 2030 - Usinfo.org
Annual Energy Outlook 2006 with Projections to 2030 - Usinfo.org
You also want an ePaper? Increase the reach of your titles
YUMPU automatically turns print PDFs into web optimized ePapers that Google loves.
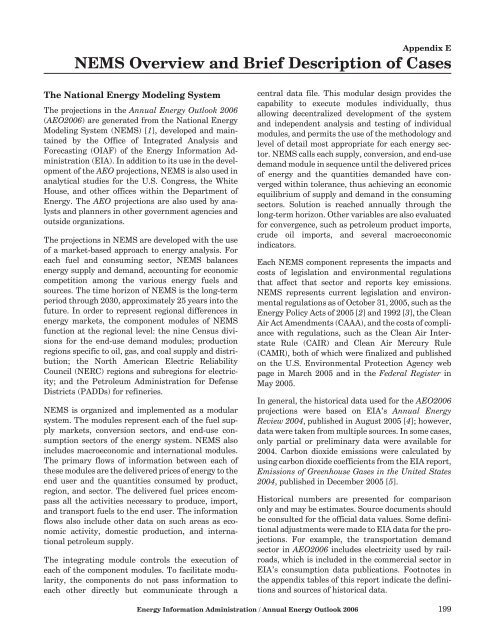
Appendix ENEMS Overview and Brief Description of CasesThe National <strong>Energy</strong> Modeling SystemThe projections in the <strong>Annual</strong> <strong>Energy</strong> <strong>Outlook</strong> <strong>2006</strong>(AEO<strong>2006</strong>) are generated from the National <strong>Energy</strong>Modeling System (NEMS) [1], developed and maintainedby the Office of Integrated Analysis andForecasting (OIAF) of the <strong>Energy</strong> Information Administration(EIA). In addition <strong>to</strong> its use in the developmen<strong>to</strong>f the AEO projections, NEMS is also used inanalytical studies for the U.S. Congress, the WhiteHouse, and other offices <strong>with</strong>in the Department of<strong>Energy</strong>. The AEO projections are also used by analystsand planners in other government agencies andoutside <strong>org</strong>anizations.The projections in NEMS are developed <strong>with</strong> the useof a market-based approach <strong>to</strong> energy analysis. Foreach fuel and consuming sec<strong>to</strong>r, NEMS balancesenergy supply and demand, accounting for economiccompetition among the various energy fuels andsources. The time horizon of NEMS is the long-termperiod through <strong>2030</strong>, approximately 25 years in<strong>to</strong> thefuture. In order <strong>to</strong> represent regional differences inenergy markets, the component modules of NEMSfunction at the regional level: the nine Census divisionsfor the end-use demand modules; productionregions specific <strong>to</strong> oil, gas, and coal supply and distribution;the North American Electric ReliabilityCouncil (NERC) regions and subregions for electricity;and the Petroleum Administration for DefenseDistricts (PADDs) for refineries.NEMS is <strong>org</strong>anized and implemented as a modularsystem. The modules represent each of the fuel supplymarkets, conversion sec<strong>to</strong>rs, and end-use consumptionsec<strong>to</strong>rs of the energy system. NEMS alsoincludes macroeconomic and international modules.The primary flows of information between each ofthese modules are the delivered prices of energy <strong>to</strong> theend user and the quantities consumed by product,region, and sec<strong>to</strong>r. The delivered fuel prices encompassall the activities necessary <strong>to</strong> produce, import,and transport fuels <strong>to</strong> the end user. The informationflows also include other data on such areas as economicactivity, domestic production, and internationalpetroleum supply.The integrating module controls the execution ofeach of the component modules. To facilitate modularity,the components do not pass information <strong>to</strong>each other directly but communicate through acentral data file. This modular design provides thecapability <strong>to</strong> execute modules individually, thusallowing decentralized development of the systemand independent analysis and testing of individualmodules, and permits the use of the methodology andlevel of detail most appropriate for each energy sec<strong>to</strong>r.NEMS calls each supply, conversion, and end-usedemand module in sequence until the delivered pricesof energy and the quantities demanded have converged<strong>with</strong>in <strong>to</strong>lerance, thus achieving an economicequilibrium of supply and demand in the consumingsec<strong>to</strong>rs. Solution is reached annually through thelong-term horizon. Other variables are also evaluatedfor convergence, such as petroleum product imports,crude oil imports, and several macroeconomicindica<strong>to</strong>rs.Each NEMS component represents the impacts andcosts of legislation and environmental regulationsthat affect that sec<strong>to</strong>r and reports key emissions.NEMS represents current legislation and environmentalregulations as of Oc<strong>to</strong>ber 31, 2005, such as the<strong>Energy</strong> Policy Acts of 2005 [2] and 1992 [3], the CleanAir Act Amendments (CAAA), and the costs of compliance<strong>with</strong> regulations, such as the Clean Air InterstateRule (CAIR) and Clean Air Mercury Rule(CAMR), both of which were finalized and publishedon the U.S. Environmental Protection Agency webpage in March 2005 and in the Federal Register inMay 2005.In general, the his<strong>to</strong>rical data used for the AEO<strong>2006</strong>projections were based on EIA’s <strong>Annual</strong> <strong>Energy</strong>Review 2004, published in August 2005 [4]; however,data were taken from multiple sources. In some cases,only partial or preliminary data were available for2004. Carbon dioxide emissions were calculated byusing carbon dioxide coefficients from the EIA report,Emissions of Greenhouse Gases in the United States2004, published in December 2005 [5].His<strong>to</strong>rical numbers are presented for comparisononly and may be estimates. Source documents shouldbe consulted for the official data values. Some definitionaladjustments were made <strong>to</strong> EIA data for the projections.For example, the transportation demandsec<strong>to</strong>r in AEO<strong>2006</strong> includes electricity used by railroads,which is included in the commercial sec<strong>to</strong>r inEIA’s consumption data publications. Footnotes inthe appendix tables of this report indicate the definitionsand sources of his<strong>to</strong>rical data.<strong>Energy</strong> Information Administration / <strong>Annual</strong> <strong>Energy</strong> <strong>Outlook</strong> <strong>2006</strong> 199


