

Annual Energy Outlook 2006 with Projections to 2030 - Usinfo.org
Annual Energy Outlook 2006 with Projections to 2030 - Usinfo.org
Annual Energy Outlook 2006 with Projections to 2030 - Usinfo.org

You also want an ePaper? Increase the reach of your titles
YUMPU automatically turns print PDFs into web optimized ePapers that Google loves.
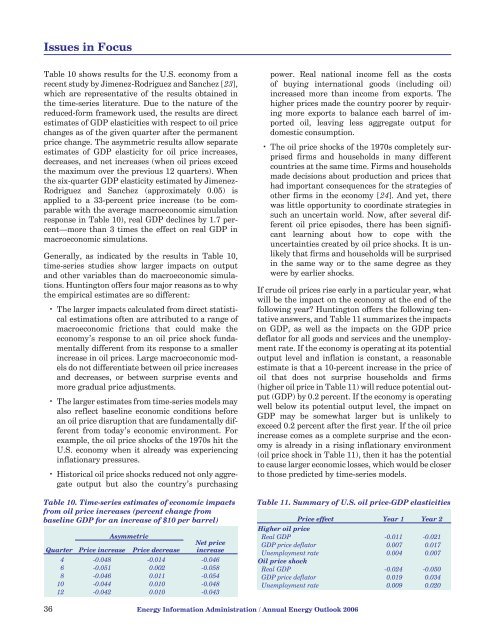
Issues in FocusTable 10 shows results for the U.S. economy from arecent study by Jimenez-Rodriguez and Sanchez [23],which are representative of the results obtained inthe time-series literature. Due <strong>to</strong> the nature of thereduced-form framework used, the results are directestimates of GDP elasticities <strong>with</strong> respect <strong>to</strong> oil pricechanges as of the given quarter after the permanentprice change. The asymmetric results allow separateestimates of GDP elasticity for oil price increases,decreases, and net increases (when oil prices exceedthe maximum over the previous 12 quarters). Whenthe six-quarter GDP elasticity estimated by Jimenez-Rodriguez and Sanchez (approximately 0.05) isapplied <strong>to</strong> a 33-percent price increase (<strong>to</strong> be comparable<strong>with</strong> the average macroeconomic simulationresponse in Table 10), real GDP declines by 1.7 percent—morethan 3 times the effect on real GDP inmacroeconomic simulations.Generally, as indicated by the results in Table 10,time-series studies show larger impacts on outputand other variables than do macroeconomic simulations.Hunting<strong>to</strong>n offers four major reasons as <strong>to</strong> whythe empirical estimates are so different:• The larger impacts calculated from direct statisticalestimations often are attributed <strong>to</strong> a range ofmacroeconomic frictions that could make theeconomy’s response <strong>to</strong> an oil price shock fundamentallydifferent from its response <strong>to</strong> a smallerincrease in oil prices. Large macroeconomic modelsdo not differentiate between oil price increasesand decreases, or between surprise events andmore gradual price adjustments.• The larger estimates from time-series models mayalso reflect baseline economic conditions beforean oil price disruption that are fundamentally differentfrom <strong>to</strong>day’s economic environment. Forexample, the oil price shocks of the 1970s hit theU.S. economy when it already was experiencinginflationary pressures.• His<strong>to</strong>rical oil price shocks reduced not only aggregateoutput but also the country’s purchasingpower. Real national income fell as the costsof buying international goods (including oil)increased more than income from exports. Thehigher prices made the country poorer by requiringmore exports <strong>to</strong> balance each barrel of importedoil, leaving less aggregate output fordomestic consumption.• The oil price shocks of the 1970s completely surprisedfirms and households in many differentcountries at the same time. Firms and householdsmade decisions about production and prices thathad important consequences for the strategies ofother firms in the economy [24]. And yet, therewas little opportunity <strong>to</strong> coordinate strategies insuch an uncertain world. Now, after several differen<strong>to</strong>il price episodes, there has been significantlearning about how <strong>to</strong> cope <strong>with</strong> theuncertainties created by oil price shocks. It is unlikelythat firms and households will be surprisedin the same way or <strong>to</strong> the same degree as theywere by earlier shocks.If crude oil prices rise early in a particular year, whatwill be the impact on the economy at the end of thefollowing year? Hunting<strong>to</strong>n offers the following tentativeanswers, and Table 11 summarizes the impactson GDP, as well as the impacts on the GDP pricedefla<strong>to</strong>r for all goods and services and the unemploymentrate. If the economy is operating at its potentialoutput level and inflation is constant, a reasonableestimate is that a 10-percent increase in the price ofoil that does not surprise households and firms(higher oil price in Table 11) will reduce potential output(GDP) by 0.2 percent. If the economy is operatingwell below its potential output level, the impact onGDP may be somewhat larger but is unlikely <strong>to</strong>exceed 0.2 percent after the first year. If the oil priceincrease comes as a complete surprise and the economyis already in a rising inflationary environment(oil price shock in Table 11), then it has the potential<strong>to</strong> cause larger economic losses, which would be closer<strong>to</strong> those predicted by time-series models.Table 10. Time-series estimates of economic impacts Table 11. Summary of U.S. oil price-GDP elasticitiesfrom oil price increases (percent change frombaseline GDP for an increase of $10 per barrel) Price effect Year 1 Year 2AsymmetricQuarter Price increase Price decreaseNet priceincrease4 -0.048 -0.014 -0.0466 -0.051 0.002 -0.0588 -0.046 0.011 -0.05410 -0.044 0.010 -0.04812 -0.042 0.010 -0.043Higher oil priceReal GDP -0.011 -0.021GDP price defla<strong>to</strong>r 0.007 0.017Unemployment rate 0.004 0.007Oil price shockReal GDP -0.024 -0.050GDP price defla<strong>to</strong>r 0.019 0.034Unemployment rate 0.009 0.02036 <strong>Energy</strong> Information Administration / <strong>Annual</strong> <strong>Energy</strong> <strong>Outlook</strong> <strong>2006</strong>


