

Annual Energy Outlook 2006 with Projections to 2030 - Usinfo.org
Annual Energy Outlook 2006 with Projections to 2030 - Usinfo.org
Annual Energy Outlook 2006 with Projections to 2030 - Usinfo.org

Create successful ePaper yourself
Turn your PDF publications into a flip-book with our unique Google optimized e-Paper software.
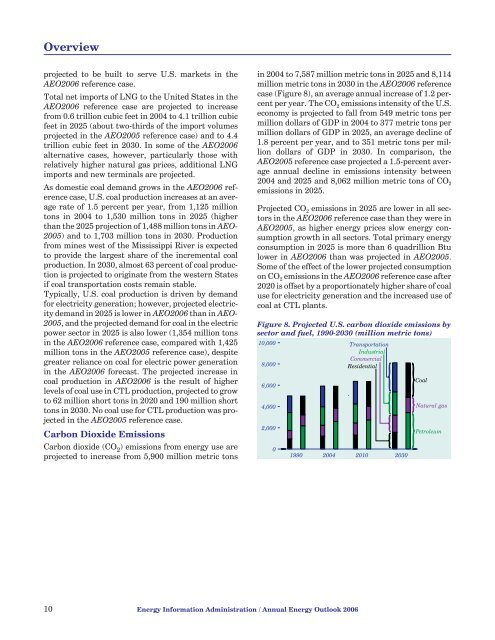
Overviewprojected <strong>to</strong> be built <strong>to</strong> serve U.S. markets in theAEO<strong>2006</strong> reference case.Total net imports of LNG <strong>to</strong> the United States in theAEO<strong>2006</strong> reference case are projected <strong>to</strong> increasefrom 0.6 trillion cubic feet in 2004 <strong>to</strong> 4.1 trillion cubicfeet in 2025 (about two-thirds of the import volumesprojected in the AEO2005 reference case) and <strong>to</strong> 4.4trillion cubic feet in <strong>2030</strong>. In some of the AEO<strong>2006</strong>alternative cases, however, particularly those <strong>with</strong>relatively higher natural gas prices, additional LNGimports and new terminals are projected.As domestic coal demand grows in the AEO<strong>2006</strong> referencecase, U.S. coal production increases at an averagerate of 1.5 percent per year, from 1,125 million<strong>to</strong>ns in 2004 <strong>to</strong> 1,530 million <strong>to</strong>ns in 2025 (higherthan the 2025 projection of 1,488 million <strong>to</strong>ns in AEO-2005) and <strong>to</strong> 1,703 million <strong>to</strong>ns in <strong>2030</strong>. Productionfrom mines west of the Mississippi River is expected<strong>to</strong> provide the largest share of the incremental coalproduction. In <strong>2030</strong>, almost 63 percent of coal productionis projected <strong>to</strong> originate from the western Statesif coal transportation costs remain stable.Typically, U.S. coal production is driven by demandfor electricity generation; however, projected electricitydemand in 2025 is lower in AEO<strong>2006</strong> than in AEO-2005, and the projected demand for coal in the electricpower sec<strong>to</strong>r in 2025 is also lower (1,354 million <strong>to</strong>nsin the AEO<strong>2006</strong> reference case, compared <strong>with</strong> 1,425million <strong>to</strong>ns in the AEO2005 reference case), despitegreater reliance on coal for electric power generationin the AEO<strong>2006</strong> forecast. The projected increase incoal production in AEO<strong>2006</strong> is the result of higherlevels of coal use in CTL production, projected <strong>to</strong> grow<strong>to</strong> 62 million short <strong>to</strong>ns in 2020 and 190 million short<strong>to</strong>ns in <strong>2030</strong>. No coal use for CTL production was projectedin the AEO2005 reference case.Carbon Dioxide EmissionsCarbon dioxide (CO 2 ) emissions from energy use areprojected <strong>to</strong> increase from 5,900 million metric <strong>to</strong>nsin 2004 <strong>to</strong> 7,587 million metric <strong>to</strong>ns in 2025 and 8,114million metric <strong>to</strong>ns in <strong>2030</strong> in the AEO<strong>2006</strong> referencecase (Figure 8), an average annual increase of 1.2 percentper year. The CO 2 emissions intensity of the U.S.economy is projected <strong>to</strong> fall from 549 metric <strong>to</strong>ns permillion dollars of GDP in 2004 <strong>to</strong> 377 metric <strong>to</strong>ns permillion dollars of GDP in 2025, an average decline of1.8 percent per year, and <strong>to</strong> 351 metric <strong>to</strong>ns per milliondollars of GDP in <strong>2030</strong>. In comparison, theAEO2005 reference case projected a 1.5-percent averageannual decline in emissions intensity between2004 and 2025 and 8,062 million metric <strong>to</strong>ns of CO 2emissions in 2025.Projected CO 2 emissions in 2025 are lower in all sec<strong>to</strong>rsin the AEO<strong>2006</strong> reference case than they were inAEO2005, as higher energy prices slow energy consumptiongrowth in all sec<strong>to</strong>rs. Total primary energyconsumption in 2025 is more than 6 quadrillion Btulower in AEO<strong>2006</strong> than was projected in AEO2005.Some of the effect of the lower projected consumptionon CO 2 emissions in the AEO<strong>2006</strong> reference case after2020 is offset by a proportionately higher share of coaluse for electricity generation and the increased use ofcoal at CTL plants.Figure 8. Projected U.S. carbon dioxide emissions bysec<strong>to</strong>r and fuel, 1990-<strong>2030</strong> (million metric <strong>to</strong>ns)10,000TransportationIndustrialCommercial8,000Residential6,0004,0002,00001990 2004 2010 <strong>2030</strong>CoalNatural gasPetroleum10 <strong>Energy</strong> Information Administration / <strong>Annual</strong> <strong>Energy</strong> <strong>Outlook</strong> <strong>2006</strong>


