

Annual Energy Outlook 2006 with Projections to 2030 - Usinfo.org
Annual Energy Outlook 2006 with Projections to 2030 - Usinfo.org
Annual Energy Outlook 2006 with Projections to 2030 - Usinfo.org

Create successful ePaper yourself
Turn your PDF publications into a flip-book with our unique Google optimized e-Paper software.
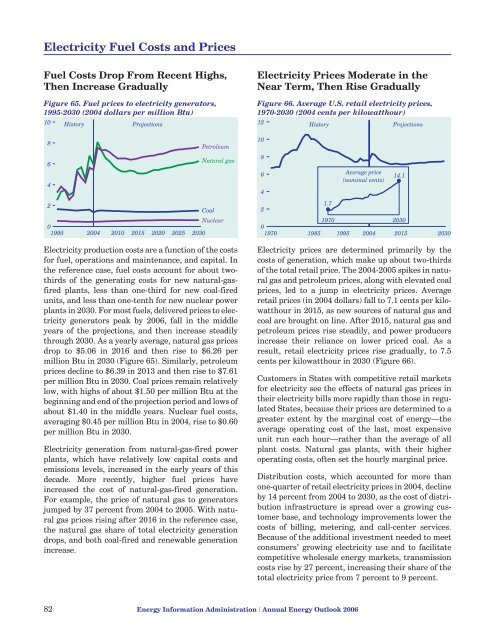
Electricity Fuel Costs and PricesFuel Costs Drop From Recent Highs,Then Increase GraduallyFigure 65. Fuel prices <strong>to</strong> electricity genera<strong>to</strong>rs,1995-<strong>2030</strong> (2004 dollars per million Btu)108642His<strong>to</strong>ry<strong>Projections</strong>PetroleumNatural gasCoalNuclear01995 2004 2010 2015 2020 2025 <strong>2030</strong>Electricity production costs are a function of the costsfor fuel, operations and maintenance, and capital. Inthe reference case, fuel costs account for about twothirdsof the generating costs for new natural-gasfiredplants, less than one-third for new coal-firedunits, and less than one-tenth for new nuclear powerplants in <strong>2030</strong>. For most fuels, delivered prices <strong>to</strong> electricitygenera<strong>to</strong>rs peak by <strong>2006</strong>, fall in the middleyears of the projections, and then increase steadilythrough <strong>2030</strong>. As a yearly average, natural gas pricesdrop <strong>to</strong> $5.06 in 2016 and then rise <strong>to</strong> $6.26 permillion Btu in <strong>2030</strong> (Figure 65). Similarly, petroleumprices decline <strong>to</strong> $6.39 in 2013 and then rise <strong>to</strong> $7.61per million Btu in <strong>2030</strong>. Coal prices remain relativelylow, <strong>with</strong> highs of about $1.50 per million Btu at thebeginning and end of the projection period and lows ofabout $1.40 in the middle years. Nuclear fuel costs,averaging $0.45 per million Btu in 2004, rise <strong>to</strong> $0.60per million Btu in <strong>2030</strong>.Electricity generation from natural-gas-fired powerplants, which have relatively low capital costs andemissions levels, increased in the early years of thisdecade. More recently, higher fuel prices haveincreased the cost of natural-gas-fired generation.For example, the price of natural gas <strong>to</strong> genera<strong>to</strong>rsjumped by 37 percent from 2004 <strong>to</strong> 2005. With naturalgas prices rising after 2016 in the reference case,the natural gas share of <strong>to</strong>tal electricity generationdrops, and both coal-fired and renewable generationincrease.Electricity Prices Moderate in theNear Term, Then Rise GraduallyFigure 66. Average U.S. retail electricity prices,1970-<strong>2030</strong> (2004 cents per kilowatthour)12 His<strong>to</strong>ry <strong>Projections</strong>1086421.7Average price(nominal cents)14.11970 <strong>2030</strong>01970 1985 1995 2004 2015 <strong>2030</strong>Electricity prices are determined primarily by thecosts of generation, which make up about two-thirdsof the <strong>to</strong>tal retail price. The 2004-2005 spikes in naturalgas and petroleum prices, along <strong>with</strong> elevated coalprices, led <strong>to</strong> a jump in electricity prices. Averageretail prices (in 2004 dollars) fall <strong>to</strong> 7.1 cents per kilowatthourin 2015, as new sources of natural gas andcoal are brought on line. After 2015, natural gas andpetroleum prices rise steadily, and power producersincrease their reliance on lower priced coal. As aresult, retail electricity prices rise gradually, <strong>to</strong> 7.5cents per kilowatthour in <strong>2030</strong> (Figure 66).Cus<strong>to</strong>mers in States <strong>with</strong> competitive retail marketsfor electricity see the effects of natural gas prices intheir electricity bills more rapidly than those in regulatedStates, because their prices are determined <strong>to</strong> agreater extent by the marginal cost of energy—theaverage operating cost of the last, most expensiveunit run each hour—rather than the average of allplant costs. Natural gas plants, <strong>with</strong> their higheroperating costs, often set the hourly marginal price.Distribution costs, which accounted for more thanone-quarter of retail electricity prices in 2004, declineby 14 percent from 2004 <strong>to</strong> <strong>2030</strong>, as the cost of distributioninfrastructure is spread over a growing cus<strong>to</strong>merbase, and technology improvements lower thecosts of billing, metering, and call-center services.Because of the additional investment needed <strong>to</strong> meetconsumers’ growing electricity use and <strong>to</strong> facilitatecompetitive wholesale energy markets, transmissioncosts rise by 27 percent, increasing their share of the<strong>to</strong>tal electricity price from 7 percent <strong>to</strong> 9 percent.82 <strong>Energy</strong> Information Administration / <strong>Annual</strong> <strong>Energy</strong> <strong>Outlook</strong> <strong>2006</strong>


