

Annual Energy Outlook 2006 with Projections to 2030 - Usinfo.org
Annual Energy Outlook 2006 with Projections to 2030 - Usinfo.org
Annual Energy Outlook 2006 with Projections to 2030 - Usinfo.org

You also want an ePaper? Increase the reach of your titles
YUMPU automatically turns print PDFs into web optimized ePapers that Google loves.
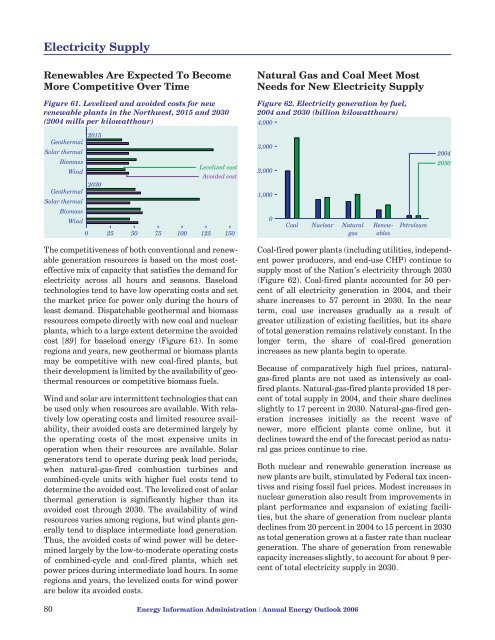
Electricity SupplyRenewables Are Expected To BecomeMore Competitive Over TimeFigure 61. Levelized and avoided costs for newrenewable plants in the Northwest, 2015 and <strong>2030</strong>(2004 mills per kilowatthour)Natural Gas and Coal Meet MostNeeds for New Electricity SupplyFigure 62. Electricity generation by fuel,2004 and <strong>2030</strong> (billion kilowatthours)4,0002015GeothermalSolar thermalBiomassLevelized costWindAvoided cost<strong>2030</strong>GeothermalSolar thermalBiomassWind3,0002,0001,0002004<strong>2030</strong>0 25 50 75 100 125 1500Coal Nuclear NaturalgasRenewablesPetroleumThe competitiveness of both conventional and renewablegeneration resources is based on the most costeffectivemix of capacity that satisfies the demand forelectricity across all hours and seasons. Baseloadtechnologies tend <strong>to</strong> have low operating costs and setthe market price for power only during the hours ofleast demand. Dispatchable geothermal and biomassresources compete directly <strong>with</strong> new coal and nuclearplants, which <strong>to</strong> a large extent determine the avoidedcost [89] for baseload energy (Figure 61). In someregions and years, new geothermal or biomass plantsmay be competitive <strong>with</strong> new coal-fired plants, buttheir development is limited by the availability of geothermalresources or competitive biomass fuels.Wind and solar are intermittent technologies that canbe used only when resources are available. With relativelylow operating costs and limited resource availability,their avoided costs are determined largely bythe operating costs of the most expensive units inoperation when their resources are available. Solargenera<strong>to</strong>rs tend <strong>to</strong> operate during peak load periods,when natural-gas-fired combustion turbines andcombined-cycle units <strong>with</strong> higher fuel costs tend <strong>to</strong>determine the avoided cost. The levelized cost of solarthermal generation is significantly higher than itsavoided cost through <strong>2030</strong>. The availability of windresources varies among regions, but wind plants generallytend <strong>to</strong> displace intermediate load generation.Thus, the avoided costs of wind power will be determinedlargely by the low-<strong>to</strong>-moderate operating costsof combined-cycle and coal-fired plants, which setpower prices during intermediate load hours. In someregions and years, the levelized costs for wind powerare below its avoided costs.Coal-fired power plants (including utilities, independentpower producers, and end-use CHP) continue <strong>to</strong>supply most of the Nation’s electricity through <strong>2030</strong>(Figure 62). Coal-fired plants accounted for 50 percen<strong>to</strong>f all electricity generation in 2004, and theirshare increases <strong>to</strong> 57 percent in <strong>2030</strong>. In the nearterm, coal use increases gradually as a result ofgreater utilization of existing facilities, but its shareof <strong>to</strong>tal generation remains relatively constant. In thelonger term, the share of coal-fired generationincreases as new plants begin <strong>to</strong> operate.Because of comparatively high fuel prices, naturalgas-firedplants are not used as intensively as coalfiredplants. Natural-gas-fired plants provided 18 percen<strong>to</strong>f <strong>to</strong>tal supply in 2004, and their share declinesslightly <strong>to</strong> 17 percent in <strong>2030</strong>. Natural-gas-fired generationincreases initially as the recent wave ofnewer, more efficient plants come online, but itdeclines <strong>to</strong>ward the end of the forecast period as naturalgas prices continue <strong>to</strong> rise.Both nuclear and renewable generation increase asnew plants are built, stimulated by Federal tax incentivesand rising fossil fuel prices. Modest increases innuclear generation also result from improvements inplant performance and expansion of existing facilities,but the share of generation from nuclear plantsdeclines from 20 percent in 2004 <strong>to</strong> 15 percent in <strong>2030</strong>as <strong>to</strong>tal generation grows at a faster rate than nucleargeneration. The share of generation from renewablecapacity increases slightly, <strong>to</strong> account for about 9 percen<strong>to</strong>f <strong>to</strong>tal electricity supply in <strong>2030</strong>.80 <strong>Energy</strong> Information Administration / <strong>Annual</strong> <strong>Energy</strong> <strong>Outlook</strong> <strong>2006</strong>


