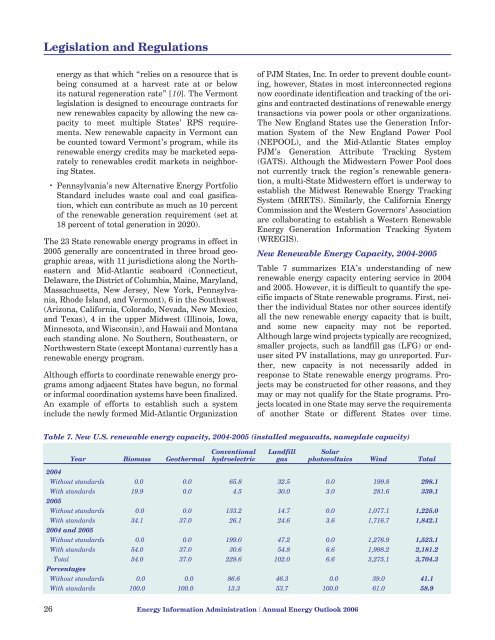
Legislation and Regulationsenergy as that which “relies on a resource that isbeing consumed at a harvest rate at or belowits natural regeneration rate” [10]. The Vermontlegislation is designed <strong>to</strong> encourage contracts fornew renewables capacity by allowing the new capacity<strong>to</strong> meet multiple States’ RPS requirements.New renewable capacity in Vermont canbe counted <strong>to</strong>ward Vermont’s program, while itsrenewable energy credits may be marketed separately<strong>to</strong> renewables credit markets in neighboringStates.• Pennsylvania’s new Alternative <strong>Energy</strong> PortfolioStandard includes waste coal and coal gasification,which can contribute as much as 10 percen<strong>to</strong>f the renewable generation requirement (set at18 percent of <strong>to</strong>tal generation in 2020).The 23 State renewable energy programs in effect in2005 generally are concentrated in three broad geographicareas, <strong>with</strong> 11 jurisdictions along the Northeasternand Mid-Atlantic seaboard (Connecticut,Delaware, the District of Columbia, Maine, Maryland,Massachusetts, New Jersey, New York, Pennsylvania,Rhode Island, and Vermont), 6 in the Southwest(Arizona, California, Colorado, Nevada, New Mexico,and Texas), 4 in the upper Midwest (Illinois, Iowa,Minnesota, and Wisconsin), and Hawaii and Montanaeach standing alone. No Southern, Southeastern, orNorthwestern State (except Montana) currently has arenewable energy program.Although efforts <strong>to</strong> coordinate renewable energy programsamong adjacent States have begun, no formalor informal coordination systems have been finalized.An example of efforts <strong>to</strong> establish such a systeminclude the newly formed Mid-Atlantic Organizationof PJM States, Inc. In order <strong>to</strong> prevent double counting,however, States in most interconnected regionsnow coordinate identification and tracking of the originsand contracted destinations of renewable energytransactions via power pools or other <strong>org</strong>anizations.The New England States use the Generation InformationSystem of the New England Power Pool(NEPOOL), and the Mid-Atlantic States employPJM’s Generation Attribute Tracking System(GATS). Although the Midwestern Power Pool doesnot currently track the region’s renewable generation,a multi-State Midwestern effort is underway <strong>to</strong>establish the Midwest Renewable <strong>Energy</strong> TrackingSystem (MRETS). Similarly, the California <strong>Energy</strong>Commission and the Western Governors’ Associationare collaborating <strong>to</strong> establish a Western Renewable<strong>Energy</strong> Generation Information Tracking System(WREGIS).New Renewable <strong>Energy</strong> Capacity, 2004-2005Table 7 summarizes EIA’s understanding of newrenewable energy capacity entering service in 2004and 2005. However, it is difficult <strong>to</strong> quantify the specificimpacts of State renewable programs. First, neitherthe individual States nor other sources identifyall the new renewable energy capacity that is built,and some new capacity may not be reported.Although large wind projects typically are recognized,smaller projects, such as landfill gas (LFG) or endusersited PV installations, may go unreported. Further,new capacity is not necessarily added inresponse <strong>to</strong> State renewable energy programs. Projectsmay be constructed for other reasons, and theymay or may not qualify for the State programs. Projectslocated in one State may serve the requirementsof another State or different States over time.Table 7. New U.S. renewable energy capacity, 2004-2005 (installed megawatts, nameplate capacity)Year Biomass GeothermalConventionalhydroelectricLandfillgasSolarpho<strong>to</strong>voltaics Wind Total2004Without standards 0.0 0.0 65.8 32.5 0.0 199.8 298.1With standards 19.9 0.0 4.5 30.0 3.0 281.6 339.12005Without standards 0.0 0.0 133.2 14.7 0.0 1,077.1 1,225.0With standards 34.1 37.0 26.1 24.6 3.6 1,716.7 1,842.12004 and 2005Without standards 0.0 0.0 199.0 47.2 0.0 1,276.9 1,523.1With standards 54.0 37.0 30.6 54.8 6.6 1,998.2 2,181.2Total 54.0 37.0 229.6 102.0 6.6 3,275.1 3,704.3PercentagesWithout standards 0.0 0.0 86.6 46.3 0.0 39.0 41.1With standards 100.0 100.0 13.3 53.7 100.0 61.0 58.926 <strong>Energy</strong> Information Administration / <strong>Annual</strong> <strong>Energy</strong> <strong>Outlook</strong> <strong>2006</strong>
Legislation and RegulationsProjects located in States <strong>with</strong>out renewable programsmay be explicitly or implicitly targeted <strong>to</strong> serveprograms in other States and, therefore, may be atleast partially “caused” by another State’s renewableprogram despite not being enumerated as such.New renewable energy capacity built <strong>to</strong>day thatappears unsupported by a State renewable programmay result from an earlier favorable experience <strong>with</strong>a State program. For example, Table 7 does notinclude 362 megawatts of wind capacity from newprojects in Iowa in the “With Standards” category,because Iowa’s mandate was fully met by 2000; nordoes it include 62 megawatts of new wind capacitybuilt in North Dakota, which has no requirement,although the new capacity serves Minnesota’s RPS.Nevertheless, Table 7 provides some indication of theextent <strong>to</strong> which renewable programs are resulting inthe construction of new renewable energy capacityand also suggests the extent <strong>to</strong> which other key fac<strong>to</strong>rs(for example, the Federal PTC) may promotegrowth in renewable capacity.Differences among renewable energy capacity additionsin different States can result from a range offac<strong>to</strong>rs separate from State renewable programs,including differences in natural endowments, electricityconsumption levels and rates of demandgrowth, the availability of alternatives, the presenceor absence of renewable energy proponents andchampions, and variations in consumer preferences.On the other hand, while States <strong>with</strong> renewableenergy requirements accounted for only 45 percent of<strong>to</strong>tal U.S. electricity supply, they accounted foralmost 60 percent of all new renewable energy capacityadded in 2004 and 2005.EIA’s analysis indicates that State-level requirementsprobably have led <strong>to</strong> somewhat more biomass,geothermal, LFG, and solar capacity than would otherwisehave been built, although the additionalamounts are small. Hydroelectric capacity does notappear <strong>to</strong> have been advanced by State-level renewablesrequirements. Expansion of wind power capacityappears <strong>to</strong> be strongly affected by the combinationof State requirements and the Federal PTC, asevidenced by the substantial construction of newwind capacity in 2005, particularly in States <strong>with</strong> RPSprograms.Among States <strong>with</strong> requirements and goals, theamount of renewable capacity added in 2004 and 2005varies significantly. Of the 23 States <strong>with</strong> renewablerequirements in 2004 and 2005, 4 have reported nonew renewable energy capacity (although requirementsin Delaware, the District of Columbia, andMaryland are new, and Connecticut is estimated <strong>to</strong>have met its program requirements already). Inanother 7 States (Arizona, Hawaii, Massachusetts,New Jersey, Rhode Island, Vermont, and Wisconsin)15 megawatts or less has been added over the 2-yearperiod. In 3 States (Maine, Nevada, and Pennsylvania),between 25 and 35 megawatts has been added; in2 (Colorado and Illinois) between 65 and 75 megawattshas been added; and in 4 (Minnesota, Montana,New Mexico, and New York) between 100 and 200megawatts has been added in each State over the past2 years. California, <strong>with</strong> nearly 500 megawatts, andTexas, <strong>with</strong> more than 700 megawatts, <strong>to</strong>getheraccount for 55 percent of all new U.S. renewablecapacity attributed <strong>to</strong> State-level renewable energyrequirements and goals in 2004 and 2005.In contrast, Oklahoma and Washing<strong>to</strong>n, which haveno renewable energy requirements, each installedbetween 250 and 300 megawatts of new renewablecapacity in 2004 and 2005, and other States <strong>with</strong>outprograms added smaller amounts. Most of the newcapacity in those States is wind power, suggestingthat good resources and the Federal PTC may be theprimary fac<strong>to</strong>rs leading <strong>to</strong> new wind power installationsthere.Despite the expansion of State renewable energyprograms, new renewables capacity accounted for afairly small fraction of new U.S. electricity supplyadded in 2004 and 2005. Including conventionalhydroelectricity, all renewables currently accountfor 9.3 percent of <strong>to</strong>tal U.S. electricity generation,<strong>with</strong> nonhydroelectric renewables accounting for2.2 percent. The 3,700 megawatts of new renewablescapacity added during 2004 and 2005 accountedfor 12 percent of the 32,000 megawatts of newgenerating capacity that entered service during theperiod.State Air Emission RegulationsThat Affect Electric Power ProducersSeveral States have recently enacted air emission regulationsthat will affect the electricity generation sec<strong>to</strong>r.The regulations govern emissions of NO x ,SO 2 ,CO 2 , and mercury from power plants. Where firmcompliance plans have been announced, State regulationsare represented in AEO<strong>2006</strong>. For example,installations of SO 2 scrubbers and selective catalyticreduction (SCR) and selective noncatalytic reduction(SNCR) NO x removal technologies associated <strong>with</strong>the largest State program, North Carolina’s CleanSmokestacks Initiative, are included. Figure 9 showshis<strong>to</strong>rical trends in SO 2 emissions for selected States.<strong>Energy</strong> Information Administration / <strong>Annual</strong> <strong>Energy</strong> <strong>Outlook</strong> <strong>2006</strong> 27