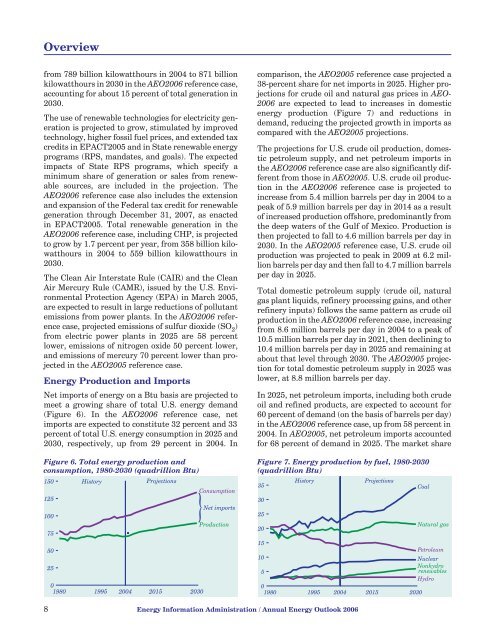
Overviewfrom 789 billion kilowatthours in 2004 <strong>to</strong> 871 billionkilowatthours in <strong>2030</strong> in the AEO<strong>2006</strong> reference case,accounting for about 15 percent of <strong>to</strong>tal generation in<strong>2030</strong>.The use of renewable technologies for electricity generationis projected <strong>to</strong> grow, stimulated by improvedtechnology, higher fossil fuel prices, and extended taxcredits in EPACT2005 and in State renewable energyprograms (RPS, mandates, and goals). The expectedimpacts of State RPS programs, which specify aminimum share of generation or sales from renewablesources, are included in the projection. TheAEO<strong>2006</strong> reference case also includes the extensionand expansion of the Federal tax credit for renewablegeneration through December 31, 2007, as enactedin EPACT2005. Total renewable generation in theAEO<strong>2006</strong> reference case, including CHP, is projected<strong>to</strong> grow by 1.7 percent per year, from 358 billion kilowatthoursin 2004 <strong>to</strong> 559 billion kilowatthours in<strong>2030</strong>.The Clean Air Interstate Rule (CAIR) and the CleanAir Mercury Rule (CAMR), issued by the U.S. EnvironmentalProtection Agency (EPA) in March 2005,are expected <strong>to</strong> result in large reductions of pollutantemissions from power plants. In the AEO<strong>2006</strong> referencecase, projected emissions of sulfur dioxide (SO 2 )from electric power plants in 2025 are 58 percentlower, emissions of nitrogen oxide 50 percent lower,and emissions of mercury 70 percent lower than projectedin the AEO2005 reference case.<strong>Energy</strong> Production and ImportsNet imports of energy on a Btu basis are projected <strong>to</strong>meet a growing share of <strong>to</strong>tal U.S. energy demand(Figure 6). In the AEO<strong>2006</strong> reference case, netimports are expected <strong>to</strong> constitute 32 percent and 33percent of <strong>to</strong>tal U.S. energy consumption in 2025 and<strong>2030</strong>, respectively, up from 29 percent in 2004. InFigure 6. Total energy production andconsumption, 1980-<strong>2030</strong> (quadrillion Btu)150 His<strong>to</strong>ry <strong>Projections</strong>12510075502501980 1995 2004 2015 <strong>2030</strong>ConsumptionNet importsProductioncomparison, the AEO2005 reference case projected a38-percent share for net imports in 2025. Higher projectionsfor crude oil and natural gas prices in AEO-<strong>2006</strong> are expected <strong>to</strong> lead <strong>to</strong> increases in domesticenergy production (Figure 7) and reductions indemand, reducing the projected growth in imports ascompared <strong>with</strong> the AEO2005 projections.The projections for U.S. crude oil production, domesticpetroleum supply, and net petroleum imports inthe AEO<strong>2006</strong> reference case are also significantly differentfrom those in AEO2005. U.S. crude oil productionin the AEO<strong>2006</strong> reference case is projected <strong>to</strong>increase from 5.4 million barrels per day in 2004 <strong>to</strong> apeak of 5.9 million barrels per day in 2014 as a resul<strong>to</strong>f increased production offshore, predominantly fromthe deep waters of the Gulf of Mexico. Production isthen projected <strong>to</strong> fall <strong>to</strong> 4.6 million barrels per day in<strong>2030</strong>. In the AEO2005 reference case, U.S. crude oilproduction was projected <strong>to</strong> peak in 2009 at 6.2 millionbarrels per day and then fall <strong>to</strong> 4.7 million barrelsper day in 2025.Total domestic petroleum supply (crude oil, naturalgas plant liquids, refinery processing gains, and otherrefinery inputs) follows the same pattern as crude oilproduction in the AEO<strong>2006</strong> reference case, increasingfrom 8.6 million barrels per day in 2004 <strong>to</strong> a peak of10.5 million barrels per day in 2021, then declining <strong>to</strong>10.4 million barrels per day in 2025 and remaining atabout that level through <strong>2030</strong>. The AEO2005 projectionfor <strong>to</strong>tal domestic petroleum supply in 2025 waslower, at 8.8 million barrels per day.In 2025, net petroleum imports, including both crudeoil and refined products, are expected <strong>to</strong> account for60 percent of demand (on the basis of barrels per day)in the AEO<strong>2006</strong> reference case, up from 58 percent in2004. In AEO2005, net petroleum imports accountedfor 68 percent of demand in 2025. The market shareFigure 7. <strong>Energy</strong> production by fuel, 1980-<strong>2030</strong>(quadrillion Btu)His<strong>to</strong>ry<strong>Projections</strong>35 Coal302520Natural gas15Petroleum10NuclearNonhydro5renewablesHydro01980 1995 2004 2015 <strong>2030</strong>8 <strong>Energy</strong> Information Administration / <strong>Annual</strong> <strong>Energy</strong> <strong>Outlook</strong> <strong>2006</strong>
Overviewof net petroleum imports grows <strong>to</strong> 62 percent ofdemand in <strong>2030</strong> in the AEO<strong>2006</strong> reference case.Despite an expected increase in distillation capacityat domestic refineries in AEO<strong>2006</strong>, net imports ofrefined petroleum products account for a growingportion of <strong>to</strong>tal net imports, increasing from 17 percentin 2004 <strong>to</strong> 22 percent in <strong>2030</strong>.Total domestic natural gas production, excluding supplementalnatural gas supplies, increases from 18.5trillion cubic feet in 2004 <strong>to</strong> 21.6 trillion cubic feet in2019, before declining <strong>to</strong> 20.8 trillion cubic feet in<strong>2030</strong> in the AEO<strong>2006</strong> reference case. In 2025, domesticnatural gas production is projected <strong>to</strong> be 21.2 trillioncubic feet, compared <strong>with</strong> 21.8 trillion cubic feetin the AEO2005 reference case. The lower level ofdomestic natural gas production in the AEO<strong>2006</strong> referencecase is entirely attributable <strong>to</strong> lower levels ofoffshore production. Offshore natural gas productionin 2025 is lower in the AEO<strong>2006</strong> reference case than itwas in AEO2005, due at least in part <strong>to</strong> the impacts ofHurricanes Katrina and Rita, which are expected <strong>to</strong>delay offshore drilling projects because of a lack ofrigs and <strong>to</strong> have a long-term effect on production levelsas a result of the slow recovery of production fromexisting fields.The incorporation of EIA data showing a lower levelof new reserve discoveries in 2004 than had beenanticipated also affects the long-term forecast for offshorenatural gas production. Lower 48 offshore productionis projected <strong>to</strong> fall slightly from the 2004 levelof 4.3 trillion cubic feet and then grow steadilythrough 2015, peaking at 5.1 trillion cubic feet as newresources come on line in the Gulf of Mexico. After2015, lower 48 offshore production declines <strong>to</strong> 4.3 trillioncubic feet in 2025 and 4.0 trillion cubic feet in<strong>2030</strong>. In the AEO2005 reference case, offshore naturalgas production was projected <strong>to</strong> increase morequickly and reach higher levels, peaking at 5.3 trillioncubic feet in 2014 before falling <strong>to</strong> 4.9 trillion cubicfeet in 2025. The projection for onshore production ofnatural gas is also generally lower for most of the projectionperiod in the AEO<strong>2006</strong> reference case thanwas projected in AEO2005. In the later years of theAEO<strong>2006</strong> reference case, however, <strong>with</strong> higher naturalgas prices, onshore production grows strongly, <strong>to</strong>14.7 trillion cubic feet in 2025—equal <strong>to</strong> the AEO-2005 projection. Projected onshore production inAEO<strong>2006</strong> remains at the 2025 level through <strong>2030</strong>.Lower 48 production of unconventional natural gas isexpected <strong>to</strong> be a major contribu<strong>to</strong>r <strong>to</strong> growth in U.S.natural gas supplies. Unconventional natural gas productionis projected <strong>to</strong> account for 45 percent ofdomestic U.S. natural gas production in <strong>2030</strong>, ascompared <strong>with</strong> the AEO2005 reference case projectionof 39 percent in 2025. In AEO<strong>2006</strong>, however,unconventional natural gas production is lower in themid-term (between <strong>2006</strong> and 2020) than was projectedin AEO2005. The lower levels of production inAEO<strong>2006</strong> before 2021 reflect a decline in overall naturalgas consumption in response <strong>to</strong> higher prices.Starting in 2021, the projected levels of unconventionalnatural gas production in the AEO<strong>2006</strong> referencecase are higher than those in AEO2005, reaching9.5 trillion cubic feet in <strong>2030</strong>.Construction planning for the Alaska natural gaspipeline is expected <strong>to</strong> start soon, and the new pipelineis expected <strong>to</strong> be completed by 2015. When thepipeline goes in<strong>to</strong> operation, Alaska’s <strong>to</strong>tal naturalgas production is projected <strong>to</strong> increase <strong>to</strong> 2.2 trillioncubic feet in 2025 (from 0.4 trillion cubic feet in 2004),the same level as projected in the AEO2005 referencecase.The projection for net U.S. pipeline imports of naturalgas from Canada and Mexico (predominantly Canada)in the AEO<strong>2006</strong> reference case in 2025 is 1.3trillion cubic feet lower than was projected in AEO-2005. AEO<strong>2006</strong> projects a continued decline in netpipeline imports, <strong>to</strong> 1.2 trillion cubic feet in <strong>2030</strong>, as aresult of depletion effects and growing domesticdemand in Canada. The AEO<strong>2006</strong> reference casereflects an expectation that growth in Canada’sunconventional natural gas production (primarilyfrom coal seams) will not be adequate <strong>to</strong> offset adecline in conventional production in Alberta, basedin part on data and projections from Canada’sNational <strong>Energy</strong> Board and other sources.Growth in LNG imports is projected <strong>to</strong> meet much ofthe increased demand for natural gas in the AEO<strong>2006</strong>reference case, but the increase is less than was projectedin the AEO2005 reference case. The growth inLNG imports is moderated by three fac<strong>to</strong>rs: highernatural gas prices reduce domestic consumption;higher world oil prices increase worldwide demandfor natural gas and LNG imports, which raises theprice of LNG; and, <strong>to</strong> a lesser extent, higher world oilprices lead <strong>to</strong> higher foreign demand for GTL production,which uses more natural gas as a feeds<strong>to</strong>ck,further increasing the price pressure on natural gasand LNG. Except for expansions of three of the fourexisting onshore U.S. LNG terminals (Cove Point,Maryland; Elba Island, Ge<strong>org</strong>ia; and Lake Charles,Louisiana), the completion of U.S. terminals currentlyunder construction, and the addition of newfacilities <strong>to</strong> serve the Gulf Coast, Southern California,Florida, and New England, no other new facilities are<strong>Energy</strong> Information Administration / <strong>Annual</strong> <strong>Energy</strong> <strong>Outlook</strong> <strong>2006</strong> 9