

Annual Energy Outlook 2006 with Projections to 2030 - Usinfo.org
Annual Energy Outlook 2006 with Projections to 2030 - Usinfo.org
Annual Energy Outlook 2006 with Projections to 2030 - Usinfo.org

Create successful ePaper yourself
Turn your PDF publications into a flip-book with our unique Google optimized e-Paper software.
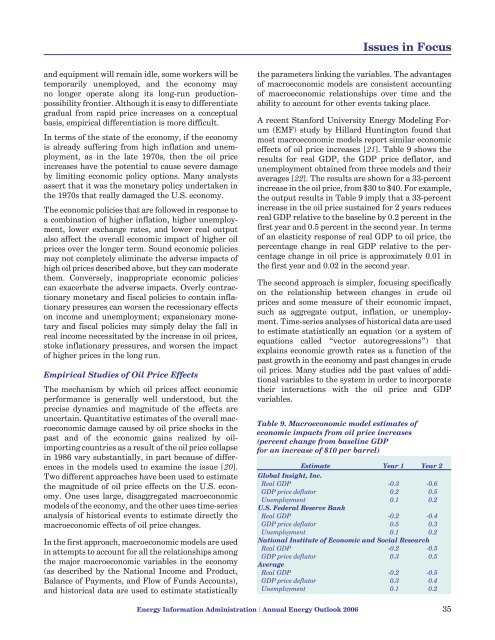
Issues in Focusand equipment will remain idle, some workers will betemporarily unemployed, and the economy mayno longer operate along its long-run productionpossibilityfrontier. Although it is easy <strong>to</strong> differentiategradual from rapid price increases on a conceptualbasis, empirical differentiation is more difficult.In terms of the state of the economy, if the economyis already suffering from high inflation and unemployment,as in the late 1970s, then the oil priceincreases have the potential <strong>to</strong> cause severe damageby limiting economic policy options. Many analystsassert that it was the monetary policy undertaken inthe 1970s that really damaged the U.S. economy.The economic policies that are followed in response <strong>to</strong>a combination of higher inflation, higher unemployment,lower exchange rates, and lower real outputalso affect the overall economic impact of higher oilprices over the longer term. Sound economic policiesmay not completely eliminate the adverse impacts ofhigh oil prices described above, but they can moderatethem. Conversely, inappropriate economic policiescan exacerbate the adverse impacts. Overly contractionarymonetary and fiscal policies <strong>to</strong> contain inflationarypressures can worsen the recessionary effectson income and unemployment; expansionary monetaryand fiscal policies may simply delay the fall inreal income necessitated by the increase in oil prices,s<strong>to</strong>ke inflationary pressures, and worsen the impac<strong>to</strong>f higher prices in the long run.Empirical Studies of Oil Price EffectsThe mechanism by which oil prices affect economicperformance is generally well unders<strong>to</strong>od, but theprecise dynamics and magnitude of the effects areuncertain. Quantitative estimates of the overall macroeconomicdamage caused by oil price shocks in thepast and of the economic gains realized by oilimportingcountries as a result of the oil price collapsein 1986 vary substantially, in part because of differencesin the models used <strong>to</strong> examine the issue [20].Two different approaches have been used <strong>to</strong> estimatethe magnitude of oil price effects on the U.S. economy.One uses large, disaggregated macroeconomicmodels of the economy, and the other uses time-seriesanalysis of his<strong>to</strong>rical events <strong>to</strong> estimate directly themacroeconomic effects of oil price changes.In the first approach, macroeconomic models are usedin attempts <strong>to</strong> account for all the relationships amongthe major macroeconomic variables in the economy(as described by the National Income and Product,Balance of Payments, and Flow of Funds Accounts),and his<strong>to</strong>rical data are used <strong>to</strong> estimate statisticallythe parameters linking the variables. The advantagesof macroeconomic models are consistent accountingof macroeconomic relationships over time and theability <strong>to</strong> account for other events taking place.A recent Stanford University <strong>Energy</strong> Modeling Forum(EMF) study by Hillard Hunting<strong>to</strong>n found thatmost macroeconomic models report similar economiceffects of oil price increases [21]. Table 9 shows theresults for real GDP, the GDP price defla<strong>to</strong>r, andunemployment obtained from three models and theiraverages [22]. The results are shown for a 33-percentincrease in the oil price, from $30 <strong>to</strong> $40. For example,the output results in Table 9 imply that a 33-percentincrease in the oil price sustained for 2 years reducesreal GDP relative <strong>to</strong> the baseline by 0.2 percent in thefirst year and 0.5 percent in the second year. In termsof an elasticity response of real GDP <strong>to</strong> oil price, thepercentage change in real GDP relative <strong>to</strong> the percentagechange in oil price is approximately 0.01 inthe first year and 0.02 in the second year.The second approach is simpler, focusing specificallyon the relationship between changes in crude oilprices and some measure of their economic impact,such as aggregate output, inflation, or unemployment.Time-series analyses of his<strong>to</strong>rical data are used<strong>to</strong> estimate statistically an equation (or a system ofequations called “vec<strong>to</strong>r au<strong>to</strong>regressions”) thatexplains economic growth rates as a function of thepast growth in the economy and past changes in crudeoil prices. Many studies add the past values of additionalvariables <strong>to</strong> the system in order <strong>to</strong> incorporatetheir interactions <strong>with</strong> the oil price and GDPvariables.Table 9. Macroeconomic model estimates ofeconomic impacts from oil price increases(percent change from baseline GDPfor an increase of $10 per barrel)Estimate Year 1 Year 2Global Insight, Inc.Real GDP -0.3 -0.6GDP price defla<strong>to</strong>r 0.2 0.5Unemployment 0.1 0.2U.S. Federal Reserve BankReal GDP -0.2 -0.4GDP price defla<strong>to</strong>r 0.5 0.3Unemployment 0.1 0.2National Institute of Economic and Social ResearchReal GDP -0.2 -0.5GDP price defla<strong>to</strong>r 0.3 0.5AverageReal GDP -0.2 -0.5GDP price defla<strong>to</strong>r 0.3 0.4Unemployment 0.1 0.2<strong>Energy</strong> Information Administration / <strong>Annual</strong> <strong>Energy</strong> <strong>Outlook</strong> <strong>2006</strong> 35


