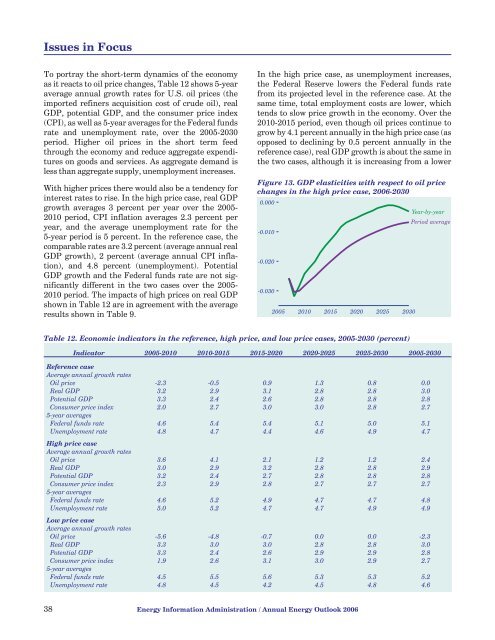
Issues in FocusTo portray the short-term dynamics of the economyas it reacts <strong>to</strong> oil price changes, Table 12 shows 5-yearaverage annual growth rates for U.S. oil prices (theimported refiners acquisition cost of crude oil), realGDP, potential GDP, and the consumer price index(CPI), as well as 5-year averages for the Federal fundsrate and unemployment rate, over the 2005-<strong>2030</strong>period. Higher oil prices in the short term feedthrough the economy and reduce aggregate expenditureson goods and services. As aggregate demand isless than aggregate supply, unemployment increases.With higher prices there would also be a tendency forinterest rates <strong>to</strong> rise. In the high price case, real GDPgrowth averages 3 percent per year over the 2005-2010 period, CPI inflation averages 2.3 percent peryear, and the average unemployment rate for the5-year period is 5 percent. In the reference case, thecomparable rates are 3.2 percent (average annual realGDP growth), 2 percent (average annual CPI inflation),and 4.8 percent (unemployment). PotentialGDP growth and the Federal funds rate are not significantlydifferent in the two cases over the 2005-2010 period. The impacts of high prices on real GDPshown in Table 12 are in agreement <strong>with</strong> the averageresults shown in Table 9.In the high price case, as unemployment increases,the Federal Reserve lowers the Federal funds ratefrom its projected level in the reference case. At thesame time, <strong>to</strong>tal employment costs are lower, whichtends <strong>to</strong> slow price growth in the economy. Over the2010-2015 period, even though oil prices continue <strong>to</strong>grow by 4.1 percent annually in the high price case (asopposed <strong>to</strong> declining by 0.5 percent annually in thereference case), real GDP growth is about the same inthe two cases, although it is increasing from a lowerFigure 13. GDP elasticities <strong>with</strong> respect <strong>to</strong> oil pricechanges in the high price case, <strong>2006</strong>-<strong>2030</strong>0.000-0.010-0.020-0.0302005 2010 2015 2020 2025 <strong>2030</strong>Year-by-yearPeriod averageTable 12. Economic indica<strong>to</strong>rs in the reference, high price, and low price cases, 2005-<strong>2030</strong> (percent)Indica<strong>to</strong>r 2005-2010 2010-2015 2015-2020 2020-2025 2025-<strong>2030</strong> 2005-<strong>2030</strong>Reference caseAverage annual growth ratesOil price -2.3 -0.5 0.9 1.3 0.8 0.0Real GDP 3.2 2.9 3.1 2.8 2.8 3.0Potential GDP 3.3 2.4 2.6 2.8 2.8 2.8Consumer price index 2.0 2.7 3.0 3.0 2.8 2.75-year averagesFederal funds rate 4.6 5.4 5.4 5.1 5.0 5.1Unemployment rate 4.8 4.7 4.4 4.6 4.9 4.7High price caseAverage annual growth ratesOil price 3.6 4.1 2.1 1.2 1.2 2.4Real GDP 3.0 2.9 3.2 2.8 2.8 2.9Potential GDP 3.2 2.4 2.7 2.8 2.8 2.8Consumer price index 2.3 2.9 2.8 2.7 2.7 2.75-year averagesFederal funds rate 4.6 5.2 4.9 4.7 4.7 4.8Unemployment rate 5.0 5.2 4.7 4.7 4.9 4.9Low price caseAverage annual growth ratesOil price -5.6 -4.8 -0.7 0.0 0.0 -2.3Real GDP 3.3 3.0 3.0 2.8 2.8 3.0Potential GDP 3.3 2.4 2.6 2.9 2.9 2.8Consumer price index 1.9 2.6 3.1 3.0 2.9 2.75-year averagesFederal funds rate 4.5 5.5 5.6 5.3 5.3 5.2Unemployment rate 4.8 4.5 4.2 4.5 4.8 4.638 <strong>Energy</strong> Information Administration / <strong>Annual</strong> <strong>Energy</strong> <strong>Outlook</strong> <strong>2006</strong>
Issues in Focusbase in the high price case. The Federal funds rate islower in the high price case than in the reference case,and the unemployment and CPI inflation rates arehigher.After 2015, as the differential in the oil price growthrates between the high price and reference casesshrinks, rebound effects from the lower employmentcosts and lower Federal funds rate in the high pricecase are stronger than the contractionary impacts ofhigher oil prices, leading <strong>to</strong> higher real GDP growthand lower CPI inflation than in the reference case. Asa result, in <strong>2030</strong>, the real GDP growth rate and unemploymentrate in the high price case are nearly thesame as in the reference case, but the Federal fundsrate is lower.The assumptions behind the oil price cases are that:the price changes do not come as a shock and come <strong>to</strong>be expected over time; the Federal Reserve is able <strong>to</strong>carry out an activist monetary policy effectively,because core inflation remains low; exchange rates donot change from those in the reference case; andother countries experience impacts similar <strong>to</strong> those inthe United States. Changes in any of these assumptionscould increase the projected impacts on the U.S.economy.The economic impact of oil price changes is an issuethat continues <strong>to</strong> attract considerable attention, especiallyat this time, when oil prices have continued <strong>to</strong>rise over the past 3 years. Over the past 30 years,much has been learned about the nature of the economicimpacts and the extent of damage possible.Empirical estimates based on his<strong>to</strong>ry provide two setsof results. In the 1970s and 1980s the damages weresubstantial, and it is believed that recession followed—andmay have been caused by—the oil priceincreases. Current literature suggests that, in <strong>to</strong>day’sU.S. economy, sustained higher oil prices can slowshort-term growth but are not likely <strong>to</strong> cause a recessionunless other fac<strong>to</strong>rs are present that shock economicdecisionmakers or lead <strong>to</strong> inappropriateeconomic policies. The AEO<strong>2006</strong> high and low pricecases provide estimates of the economic impacts onsuch an economy, and the projections in the pricecases are <strong>with</strong>in the range that other macroeconomicmodels predict.Changing Trends in the Refining IndustryThere have been some major changes in the U.S.refining industry recently, prompted in part by a significantdecline in the quality of imported crude oiland by increasing restrictions on the quality offinished products. As a result, high-quality crudes,such as the WTI crude that serves as a benchmark foroil futures on the New York Mercantile Exchange(NYMEX), have been trading at record premiums <strong>to</strong>the OPEC Basket price.WTI is a “light, sweet” crude: light because of its lowdensity and sweet because it has less than 0.5 percentsulfur content by weight. This combination of characteristicsmakes it an ideal crude oil <strong>to</strong> be refined in theUnited States, yielding a greater portion of its volumeas “light products,” including both gasoline and dieselfuel. Premium crudes like WTI yield almost 70 percen<strong>to</strong>f their volume as light, high-value products,whereas heavier crudes like Mars (from the deepwaterGulf of Mexico) yield only about 50 percent oftheir volume as light products. The AEO<strong>2006</strong> projectionsuse the average price of imported light, sweetcrudes as the benchmark world oil price [25].The average sulfur content of U.S. crude oil importsincreased from 0.9 percent in 1985 <strong>to</strong> 1.4 percent in2005 [26], and the slate of imports is expected <strong>to</strong> continue“souring” in coming years. Crude oils are alsobecoming heavier and more corrosive than they werein the past, largely because fields <strong>with</strong> higher qualityvarieties were the first <strong>to</strong> be developed, and refiners’preference for quality crudes has led <strong>to</strong> the depletionof those reserves over the past 100 years and reducedthe market share of the light, sweet crude thatremains.The industry standard measure for oil density is APIgravity; a lower gravity indicates higher density(heavy viscous oil), and a higher gravity indicateslower density (lighter, thinner oil). Over the past 20years, the API gravity of imported crude oil hassteadily declined, from 32.5 degrees <strong>to</strong> 30.2 degrees[27]. The standard measure for corrosiveness is the<strong>to</strong>tal acid number (TAN), indicating the number ofmilligrams of potassium hydroxide needed <strong>to</strong> neutralizethe acid in 1 gram of oil. The most corrosivecrudes, <strong>with</strong> TANs greater than 1, require significantaccommodation <strong>to</strong> be processed. Usually, their corrosivenessis mitigated by the addition of basic compounds<strong>to</strong> neutralize the acid; however, some refinershave chosen instead <strong>to</strong> upgrade all their piping andunit materials <strong>to</strong> stainless steel. Whereas there werevirtually no high-TAN crudes processed in 1990, theynow make up about 2 percent of the crude oil slate,and a Purvin & Gertz forecast indicates that they willincrease <strong>to</strong> 5 percent or more in 2020 [28] (Figure 14).As refining inputs have declined in quality, demandfor high-quality refined products has increased. The<strong>Energy</strong> Information Administration / <strong>Annual</strong> <strong>Energy</strong> <strong>Outlook</strong> <strong>2006</strong> 39