

Annual Energy Outlook 2006 with Projections to 2030 - Usinfo.org
Annual Energy Outlook 2006 with Projections to 2030 - Usinfo.org
Annual Energy Outlook 2006 with Projections to 2030 - Usinfo.org

You also want an ePaper? Increase the reach of your titles
YUMPU automatically turns print PDFs into web optimized ePapers that Google loves.
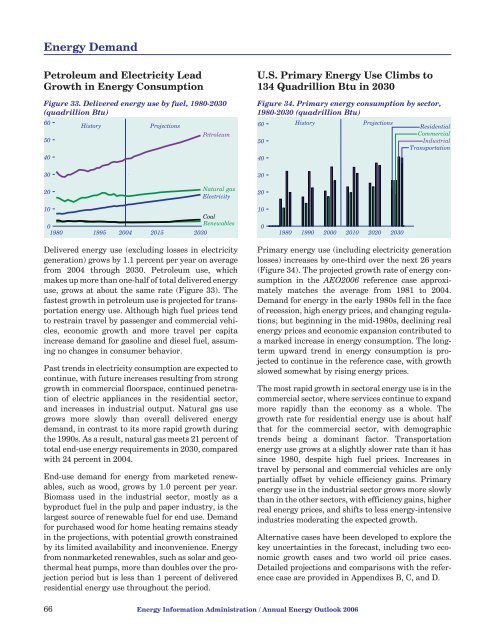
<strong>Energy</strong> DemandPetroleum and Electricity LeadGrowth in <strong>Energy</strong> ConsumptionFigure 33. Delivered energy use by fuel, 1980-<strong>2030</strong>(quadrillion Btu)60504030His<strong>to</strong>ry<strong>Projections</strong>PetroleumU.S. Primary <strong>Energy</strong> Use Climbs <strong>to</strong>134 Quadrillion Btu in <strong>2030</strong>Figure 34. Primary energy consumption by sec<strong>to</strong>r,1980-<strong>2030</strong> (quadrillion Btu)60His<strong>to</strong>ry<strong>Projections</strong>ResidentialCommercial50IndustrialTransportation403020Natural gasElectricity2010Coal0Renewables1980 1995 2004 2015 <strong>2030</strong>1001980 1990 2000 2010 2020 <strong>2030</strong>Delivered energy use (excluding losses in electricitygeneration) grows by 1.1 percent per year on averagefrom 2004 through <strong>2030</strong>. Petroleum use, whichmakes up more than one-half of <strong>to</strong>tal delivered energyuse, grows at about the same rate (Figure 33). Thefastest growth in petroleum use is projected for transportationenergy use. Although high fuel prices tend<strong>to</strong> restrain travel by passenger and commercial vehicles,economic growth and more travel per capitaincrease demand for gasoline and diesel fuel, assumingno changes in consumer behavior.Past trends in electricity consumption are expected <strong>to</strong>continue, <strong>with</strong> future increases resulting from stronggrowth in commercial floorspace, continued penetrationof electric appliances in the residential sec<strong>to</strong>r,and increases in industrial output. Natural gas usegrows more slowly than overall delivered energydemand, in contrast <strong>to</strong> its more rapid growth duringthe 1990s. As a result, natural gas meets 21 percent of<strong>to</strong>tal end-use energy requirements in <strong>2030</strong>, compared<strong>with</strong> 24 percent in 2004.End-use demand for energy from marketed renewables,such as wood, grows by 1.0 percent per year.Biomass used in the industrial sec<strong>to</strong>r, mostly as abyproduct fuel in the pulp and paper industry, is thelargest source of renewable fuel for end use. Demandfor purchased wood for home heating remains steadyin the projections, <strong>with</strong> potential growth constrainedby its limited availability and inconvenience. <strong>Energy</strong>from nonmarketed renewables, such as solar and geothermalheat pumps, more than doubles over the projectionperiod but is less than 1 percent of deliveredresidential energy use throughout the period.Primary energy use (including electricity generationlosses) increases by one-third over the next 26 years(Figure 34). The projected growth rate of energy consumptionin the AEO<strong>2006</strong> reference case approximatelymatches the average from 1981 <strong>to</strong> 2004.Demand for energy in the early 1980s fell in the faceof recession, high energy prices, and changing regulations;but beginning in the mid-1980s, declining realenergy prices and economic expansion contributed <strong>to</strong>a marked increase in energy consumption. The longtermupward trend in energy consumption is projected<strong>to</strong> continue in the reference case, <strong>with</strong> growthslowed somewhat by rising energy prices.The most rapid growth in sec<strong>to</strong>ral energy use is in thecommercial sec<strong>to</strong>r, where services continue <strong>to</strong> expandmore rapidly than the economy as a whole. Thegrowth rate for residential energy use is about halfthat for the commercial sec<strong>to</strong>r, <strong>with</strong> demographictrends being a dominant fac<strong>to</strong>r. Transportationenergy use grows at a slightly slower rate than it hassince 1980, despite high fuel prices. Increases intravel by personal and commercial vehicles are onlypartially offset by vehicle efficiency gains. Primaryenergy use in the industrial sec<strong>to</strong>r grows more slowlythan in the other sec<strong>to</strong>rs, <strong>with</strong> efficiency gains, higherreal energy prices, and shifts <strong>to</strong> less energy-intensiveindustries moderating the expected growth.Alternative cases have been developed <strong>to</strong> explore thekey uncertainties in the forecast, including two economicgrowth cases and two world oil price cases.Detailed projections and comparisons <strong>with</strong> the referencecase are provided in Appendixes B, C, and D.66 <strong>Energy</strong> Information Administration / <strong>Annual</strong> <strong>Energy</strong> <strong>Outlook</strong> <strong>2006</strong>


