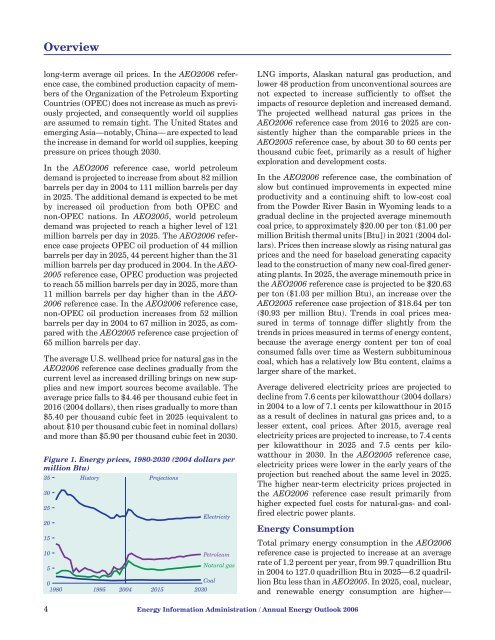
Overviewlong-term average oil prices. In the AEO<strong>2006</strong> referencecase, the combined production capacity of membersof the Organization of the Petroleum ExportingCountries (OPEC) does not increase as much as previouslyprojected, and consequently world oil suppliesare assumed <strong>to</strong> remain tight. The United States andemerging Asia—notably, China— are expected <strong>to</strong> leadthe increase in demand for world oil supplies, keepingpressure on prices though <strong>2030</strong>.In the AEO<strong>2006</strong> reference case, world petroleumdemand is projected <strong>to</strong> increase from about 82 millionbarrels per day in 2004 <strong>to</strong> 111 million barrels per dayin 2025. The additional demand is expected <strong>to</strong> be metby increased oil production from both OPEC andnon-OPEC nations. In AEO2005, world petroleumdemand was projected <strong>to</strong> reach a higher level of 121million barrels per day in 2025. The AEO<strong>2006</strong> referencecase projects OPEC oil production of 44 millionbarrels per day in 2025, 44 percent higher than the 31million barrels per day produced in 2004. In the AEO-2005 reference case, OPEC production was projected<strong>to</strong> reach 55 million barrels per day in 2025, more than11 million barrels per day higher than in the AEO-<strong>2006</strong> reference case. In the AEO<strong>2006</strong> reference case,non-OPEC oil production increases from 52 millionbarrels per day in 2004 <strong>to</strong> 67 million in 2025, as compared<strong>with</strong> the AEO2005 reference case projection of65 million barrels per day.The average U.S. wellhead price for natural gas in theAEO<strong>2006</strong> reference case declines gradually from thecurrent level as increased drilling brings on new suppliesand new import sources become available. Theaverage price falls <strong>to</strong> $4.46 per thousand cubic feet in2016 (2004 dollars), then rises gradually <strong>to</strong> more than$5.40 per thousand cubic feet in 2025 (equivalent <strong>to</strong>about $10 per thousand cubic feet in nominal dollars)and more than $5.90 per thousand cubic feet in <strong>2030</strong>.Figure 1. <strong>Energy</strong> prices, 1980-<strong>2030</strong> (2004 dollars permillion Btu)3530252015105His<strong>to</strong>ry<strong>Projections</strong>ElectricityPetroleum0Coal1980 1995 2004 2015 <strong>2030</strong>Natural gasLNG imports, Alaskan natural gas production, andlower 48 production from unconventional sources arenot expected <strong>to</strong> increase sufficiently <strong>to</strong> offset theimpacts of resource depletion and increased demand.The projected wellhead natural gas prices in theAEO<strong>2006</strong> reference case from 2016 <strong>to</strong> 2025 are consistentlyhigher than the comparable prices in theAEO2005 reference case, by about 30 <strong>to</strong> 60 cents perthousand cubic feet, primarily as a result of higherexploration and development costs.In the AEO<strong>2006</strong> reference case, the combination ofslow but continued improvements in expected mineproductivity and a continuing shift <strong>to</strong> low-cost coalfrom the Powder River Basin in Wyoming leads <strong>to</strong> agradual decline in the projected average minemouthcoal price, <strong>to</strong> approximately $20.00 per <strong>to</strong>n ($1.00 permillion British thermal units [Btu]) in 2021 (2004 dollars).Prices then increase slowly as rising natural gasprices and the need for baseload generating capacitylead <strong>to</strong> the construction of many new coal-fired generatingplants. In 2025, the average minemouth price inthe AEO<strong>2006</strong> reference case is projected <strong>to</strong> be $20.63per <strong>to</strong>n ($1.03 per million Btu), an increase over theAEO2005 reference case projection of $18.64 per <strong>to</strong>n($0.93 per million Btu). Trends in coal prices measuredin terms of <strong>to</strong>nnage differ slightly from thetrends in prices measured in terms of energy content,because the average energy content per <strong>to</strong>n of coalconsumed falls over time as Western subbituminouscoal, which has a relatively low Btu content, claims alarger share of the market.Average delivered electricity prices are projected <strong>to</strong>decline from 7.6 cents per kilowatthour (2004 dollars)in 2004 <strong>to</strong> a low of 7.1 cents per kilowatthour in 2015as a result of declines in natural gas prices and, <strong>to</strong> alesser extent, coal prices. After 2015, average realelectricity prices are projected <strong>to</strong> increase, <strong>to</strong> 7.4 centsper kilowatthour in 2025 and 7.5 cents per kilowatthourin <strong>2030</strong>. In the AEO2005 reference case,electricity prices were lower in the early years of theprojection but reached about the same level in 2025.The higher near-term electricity prices projected inthe AEO<strong>2006</strong> reference case result primarily fromhigher expected fuel costs for natural-gas- and coalfiredelectric power plants.<strong>Energy</strong> ConsumptionTotal primary energy consumption in the AEO<strong>2006</strong>reference case is projected <strong>to</strong> increase at an averagerate of 1.2 percent per year, from 99.7 quadrillion Btuin 2004 <strong>to</strong> 127.0 quadrillion Btu in 2025—6.2 quadrillionBtu less than in AEO2005. In 2025, coal, nuclear,and renewable energy consumption are higher—4 <strong>Energy</strong> Information Administration / <strong>Annual</strong> <strong>Energy</strong> <strong>Outlook</strong> <strong>2006</strong>
Overviewwhile petroleum and natural gas consumption arelower—in the AEO<strong>2006</strong> reference case than in AEO-2005. Among the most important fac<strong>to</strong>rs accountingfor the differences are higher energy prices, particularlyfor petroleum and natural gas; lower projectedgrowth rates in the manufacturing portion of theindustrial sec<strong>to</strong>r, which traditionally includes themost energy-intensive industries; greater penetrationby hybrid and diesel vehicles in the transportationsec<strong>to</strong>r as consumers focus more on fuelefficiency; and the impacts of the recently passedEPACT2005, which are projected <strong>to</strong> reduce energyconsumption in the residential and commercial sec<strong>to</strong>rsand slow the growth of electricity demand.As a result of demographic trends and housing preferences,delivered residential energy consumption inthe AEO<strong>2006</strong> reference case is projected <strong>to</strong> grow from11.4 quadrillion Btu in 2004 <strong>to</strong> 13.6 quadrillion Btu in2025 (Figure 2), 0.6 quadrillion Btu lower than inAEO2005. Higher projected energy prices in AEO-<strong>2006</strong> and the impacts of EPACT2005 are expected <strong>to</strong>help reduce energy consumption for space conditioningand lighting.Consistent <strong>with</strong> projected growth in commercialfloorspace in the AEO<strong>2006</strong> reference case, deliveredcommercial energy consumption is projected <strong>to</strong> reach11.5 quadrillion Btu in 2025. In comparison, theAEO2005 reference case projected 12.5 quadrillionBtu of commercial delivered energy consumption in2025. Three changes contribute <strong>to</strong> the lower projectionin AEO<strong>2006</strong>: significantly higher fossil fuelenergy prices, adoption of a revised projection of commercialfloorspace based on updated his<strong>to</strong>rical data,and the impacts of the EPACT2005 provisionsincluded in the reference case.After falling <strong>to</strong> relatively low levels in the early 1980s,industrial energy consumption recovered and peakedFigure 2. Delivered energy consumptionby sec<strong>to</strong>r, 1980-<strong>2030</strong> (quadrillion Btu)40302010His<strong>to</strong>ry<strong>Projections</strong>01980 1995 2004 2015 <strong>2030</strong>TransportationIndustrialResidentialCommercialin 1997. In the 2000 <strong>to</strong> 2003 period, industrial sec<strong>to</strong>ractivity was reduced by an economic recession. Theindustrial sec<strong>to</strong>r is projected <strong>to</strong> experience more typicaloutput growth rates over the AEO<strong>2006</strong> projectionperiod, and industrial energy consumption isexpected <strong>to</strong> reflect this trend. The industrial value ofshipments in the AEO<strong>2006</strong> reference case is projected<strong>to</strong> grow by 2.0 percent per year from 2004 <strong>to</strong> 2025,more slowly than in AEO2005 (2.2 percent per year)due <strong>to</strong> a slight slowdown in projected investmentspending, higher energy prices, and increased competitionfrom imports. Delivered industrial energy consumptionin the AEO<strong>2006</strong> reference case is projected<strong>to</strong> reach 30.6 quadrillion Btu in 2025, slightly lowerthan the AEO2005 projection of 30.8 quadrillion Btu.The AEO<strong>2006</strong> projection includes 1.2 quadrillion Btuof coal consumption in CTL plants, which was notincluded in AEO2005.Delivered energy consumption in the transportationsec<strong>to</strong>r in the AEO<strong>2006</strong> reference case is projected <strong>to</strong><strong>to</strong>tal 37.3 quadrillion Btu in 2025, 2.7 quadrillion Btulower than the AEO2005 projection. The lower levelof consumption reflects both slower growth in milestraveled and higher vehicle efficiency. Over the past20 years, light-duty vehicle travel has grown by about3 percent annually. In the AEO<strong>2006</strong> reference case itis projected <strong>to</strong> grow at a rate of 1.8 percent per yearthrough 2025 (as compared <strong>with</strong> 2.1 percent per yearin AEO2005), reflecting demographic fac<strong>to</strong>rs (forexample, the leveling off of increases in the labor forceparticipation rate for women) and higher energyprices. The projected average fuel economy of newlight-duty vehicles in 2025 is also higher in the AEO-<strong>2006</strong> reference case than was projected in AEO2005,primarily because the higher projected fuel prices inthe AEO<strong>2006</strong> forecast are expected <strong>to</strong> lead consumers<strong>to</strong> demand better fuel economy, slowing the growth insales of new pickup trucks and sport utility vehicles.Total electricity consumption, including both purchasesfrom electric power producers and on-sitegeneration, is projected <strong>to</strong> grow from 3,729 billionkilowatthours in 2004 <strong>to</strong> 5,208 billion kilowatthoursin 2025, increasing at an average annual rate of 1.6percent in the AEO<strong>2006</strong> reference case. In comparison,<strong>to</strong>tal electricity consumption of 5,467 billionkilowatthours in 2025 was projected in AEO2005.Growth in electricity use for computers, office equipment,and a variety of electrical appliances in theend-use sec<strong>to</strong>rs is partially offset in the AEO<strong>2006</strong> referencecase by improved efficiency in these and other,more traditional, electrical applications.Total consumption of natural gas in the AEO<strong>2006</strong> referencecase is projected <strong>to</strong> increase from 22.4 trillion<strong>Energy</strong> Information Administration / <strong>Annual</strong> <strong>Energy</strong> <strong>Outlook</strong> <strong>2006</strong> 5
- Page 1 and 2: DOE/EIA-0383(2006)February 2006Annu
- Page 3 and 4: DOE/EIA-0383(2006)Annual Energy Out
- Page 5 and 6: ContentsPageOverview ..............
- Page 7 and 8: ContentsFigures (Continued)Page11.
- Page 9: ContentsFigures (Continued)Page109.
- Page 12 and 13: OverviewEnergy Trends to 2030The En
- Page 16 and 17: Overviewcubic feet in 2004 to 27.0
- Page 18 and 19: Overviewfrom 789 billion kilowattho
- Page 20 and 21: Overviewprojected to be built to se
- Page 23 and 24: Legislation andRegulations
- Page 25 and 26: Legislation and Regulationsand inst
- Page 27 and 28: Legislation and RegulationsIndustri
- Page 29 and 30: Legislation and RegulationsIn addit
- Page 31 and 32: Legislation and Regulationsland wil
- Page 33 and 34: Legislation and RegulationsTable 2.
- Page 35 and 36: Legislation and Regulations• Unde
- Page 37 and 38: Legislation and RegulationsProjects
- Page 39 and 40: Legislation and Regulationsplants w
- Page 41 and 42: Issues in Focus
- Page 43 and 44: Issues in Focusworld oil price incr
- Page 45 and 46: Issues in Focusand equipment will r
- Page 47 and 48: Issues in FocusAEO2006 Price CasesT
- Page 49 and 50: Issues in Focusbase in the high pri
- Page 51 and 52: Issues in Focusin gasification unit
- Page 53 and 54: Issues in Focusrevolutionize transp
- Page 55 and 56: Issues in Focussynthesis gas. Any o
- Page 57 and 58: Issues in Focusenvironmental impact
- Page 59 and 60: Issues in Focussubstantial incremen
- Page 61 and 62: Issues in FocusMarket penetration o
- Page 63 and 64: Issues in FocusAccording to most an
- Page 65 and 66:
Issues in FocusThere are two leadin
- Page 67 and 68:
Issues in Focuscost reductions are
- Page 69 and 70:
Issues in Focusthe early years of t
- Page 71 and 72:
Market TrendsThe projections in AEO
- Page 73 and 74:
Trends in Economic ActivityOutput G
- Page 75 and 76:
Energy DemandAverage Energy Use per
- Page 77 and 78:
Residential Sector Energy DemandDem
- Page 79 and 80:
Commercial Sector Energy DemandEcon
- Page 81 and 82:
Industrial Sector Energy DemandAdva
- Page 83 and 84:
Industrial Sector Energy DemandEner
- Page 85 and 86:
Transportation Sector Energy Demand
- Page 87 and 88:
Electricity Demand and SupplyContin
- Page 89 and 90:
Electricity SupplyEPACT2005 Tax Cre
- Page 91 and 92:
Electricity From Renewable SourcesT
- Page 93 and 94:
Electricity Alternative CasesFaster
- Page 95 and 96:
Natural Gas DemandIncreases in Natu
- Page 97 and 98:
Natural Gas PricesProjected Natural
- Page 99 and 100:
Natural Gas Alternative CasesNatura
- Page 101 and 102:
Oil Prices and ProductionOil Prices
- Page 103 and 104:
Oil Price and Technology CasesU.S.
- Page 105 and 106:
Refined Petroleum ProductsTransport
- Page 107 and 108:
Ethanol and Synthetic FuelsU.S. Dem
- Page 109 and 110:
Coal Mine Employment and Coal Price
- Page 111 and 112:
Coal ConsumptionCoal-Fired Generato
- Page 113 and 114:
Carbon Dioxide EmissionsHigher Ener
- Page 115:
Nitrogen Oxide and Mercury Emission
- Page 118 and 119:
Forecast ComparisonsOnly GII produc
- Page 120 and 121:
Forecast Comparisonsconsumption and
- Page 122 and 123:
Forecast ComparisonsNatural GasPubl
- Page 124 and 125:
Forecast Comparisonsproviding about
- Page 126 and 127:
Forecast Comparisonsrefiners acquis
- Page 128 and 129:
Forecast Comparisonsconsumption. In
- Page 130 and 131:
Notes and SourcesText NotesLegislat
- Page 132 and 133:
Notes and Sources[48]These costs re
- Page 134 and 135:
Notes and SourcesTable Notes and So
- Page 136 and 137:
Notes and SourcesFigure 28. Energy
- Page 138 and 139:
Notes and SourcesFigure 81. Net imp
- Page 141:
Appendixes
- Page 144 and 145:
Reference Case
- Page 146 and 147:
Reference Case
- Page 148 and 149:
Reference Case
- Page 150 and 151:
Reference Case
- Page 152 and 153:
Reference Case
- Page 154 and 155:
Reference Case
- Page 156 and 157:
Reference Case
- Page 158 and 159:
Reference Case
- Page 160 and 161:
Reference Case
- Page 162 and 163:
Reference Case
- Page 164 and 165:
Reference Case
- Page 166 and 167:
Reference Case
- Page 168 and 169:
Reference Case
- Page 170 and 171:
Reference Case
- Page 172 and 173:
Reference Case
- Page 175 and 176:
Appendix BEconomic Growth Case Comp
- Page 177 and 178:
Economic Growth Case Comparisons
- Page 179 and 180:
Economic Growth Case Comparisons
- Page 181:
Economic Growth Case Comparisons
- Page 184 and 185:
Price Case Comparisons
- Page 186 and 187:
Price Case Comparisons
- Page 188 and 189:
Price Case Comparisons
- Page 190 and 191:
Price Case Comparisons
- Page 192 and 193:
Price Case Comparisons
- Page 194 and 195:
Appendix DResults from Side Cases
- Page 196 and 197:
Results from Side Cases
- Page 198 and 199:
Results from Side Cases
- Page 200 and 201:
Results from Side Cases
- Page 202 and 203:
Results from Side Cases
- Page 204 and 205:
Results from Side Cases
- Page 206 and 207:
Results from Side Cases
- Page 208 and 209:
Results from Side Cases
- Page 210 and 211:
NEMS Overview and Brief Description
- Page 212 and 213:
NEMS Overview and Brief Description
- Page 214 and 215:
NEMS Overview and Brief Description
- Page 216 and 217:
NEMS Overview and Brief Description
- Page 218 and 219:
NEMS Overview and Brief Description
- Page 220 and 221:
NEMS Overview and Brief Description
- Page 223 and 224:
Appendix FRegional MapsEnergy Infor
- Page 225 and 226:
Regional Maps Energy Information
- Page 227 and 228:
Regional Maps Energy Information Ad
- Page 229:
Regional MapsEnergy Information Adm
- Page 233:
The Energy Information Administrati