

Annual Energy Outlook 2006 with Projections to 2030 - Usinfo.org
Annual Energy Outlook 2006 with Projections to 2030 - Usinfo.org
Annual Energy Outlook 2006 with Projections to 2030 - Usinfo.org

Create successful ePaper yourself
Turn your PDF publications into a flip-book with our unique Google optimized e-Paper software.
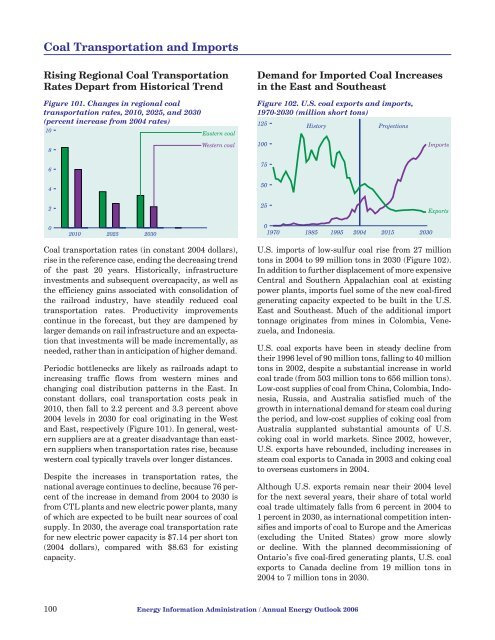
Coal Transportation and ImportsRising Regional Coal TransportationRates Depart from His<strong>to</strong>rical TrendDemand for Imported Coal Increasesin the East and SoutheastFigure 101. Changes in regional coaltransportation rates, 2010, 2025, and <strong>2030</strong>(percent increase from 2004 rates)1086Eastern coalWestern coalFigure 102. U.S. coal exports and imports,1970-<strong>2030</strong> (million short <strong>to</strong>ns)12510075His<strong>to</strong>ry<strong>Projections</strong>Imports450225Exports02010 2025 <strong>2030</strong>01970 1985 1995 2004 2015 <strong>2030</strong>Coal transportation rates (in constant 2004 dollars),rise in the reference case, ending the decreasing trendof the past 20 years. His<strong>to</strong>rically, infrastructureinvestments and subsequent overcapacity, as well asthe efficiency gains associated <strong>with</strong> consolidation ofthe railroad industry, have steadily reduced coaltransportation rates. Productivity improvementscontinue in the forecast, but they are dampened bylarger demands on rail infrastructure and an expectationthat investments will be made incrementally, asneeded, rather than in anticipation of higher demand.Periodic bottlenecks are likely as railroads adapt <strong>to</strong>increasing traffic flows from western mines andchanging coal distribution patterns in the East. Inconstant dollars, coal transportation costs peak in2010, then fall <strong>to</strong> 2.2 percent and 3.3 percent above2004 levels in <strong>2030</strong> for coal originating in the Westand East, respectively (Figure 101). In general, westernsuppliers are at a greater disadvantage than easternsuppliers when transportation rates rise, becausewestern coal typically travels over longer distances.Despite the increases in transportation rates, thenational average continues <strong>to</strong> decline, because 76 percen<strong>to</strong>f the increase in demand from 2004 <strong>to</strong> <strong>2030</strong> isfrom CTL plants and new electric power plants, manyof which are expected <strong>to</strong> be built near sources of coalsupply. In <strong>2030</strong>, the average coal transportation ratefor new electric power capacity is $7.14 per short <strong>to</strong>n(2004 dollars), compared <strong>with</strong> $8.63 for existingcapacity.U.S. imports of low-sulfur coal rise from 27 million<strong>to</strong>ns in 2004 <strong>to</strong> 99 million <strong>to</strong>ns in <strong>2030</strong> (Figure 102).In addition <strong>to</strong> further displacement of more expensiveCentral and Southern Appalachian coal at existingpower plants, imports fuel some of the new coal-firedgenerating capacity expected <strong>to</strong> be built in the U.S.East and Southeast. Much of the additional import<strong>to</strong>nnage originates from mines in Colombia, Venezuela,and Indonesia.U.S. coal exports have been in steady decline fromtheir 1996 level of 90 million <strong>to</strong>ns, falling <strong>to</strong> 40 million<strong>to</strong>ns in 2002, despite a substantial increase in worldcoal trade (from 503 million <strong>to</strong>ns <strong>to</strong> 656 million <strong>to</strong>ns).Low-cost supplies of coal from China, Colombia, Indonesia,Russia, and Australia satisfied much of thegrowth in international demand for steam coal duringthe period, and low-cost supplies of coking coal fromAustralia supplanted substantial amounts of U.S.coking coal in world markets. Since 2002, however,U.S. exports have rebounded, including increases insteam coal exports <strong>to</strong> Canada in 2003 and coking coal<strong>to</strong> overseas cus<strong>to</strong>mers in 2004.Although U.S. exports remain near their 2004 levelfor the next several years, their share of <strong>to</strong>tal worldcoal trade ultimately falls from 6 percent in 2004 <strong>to</strong>1 percent in <strong>2030</strong>, as international competition intensifiesand imports of coal <strong>to</strong> Europe and the Americas(excluding the United States) grow more slowlyor decline. With the planned decommissioning ofOntario’s five coal-fired generating plants, U.S. coalexports <strong>to</strong> Canada decline from 19 million <strong>to</strong>ns in2004 <strong>to</strong> 7 million <strong>to</strong>ns in <strong>2030</strong>.100 <strong>Energy</strong> Information Administration / <strong>Annual</strong> <strong>Energy</strong> <strong>Outlook</strong> <strong>2006</strong>


