

Annual Energy Outlook 2006 with Projections to 2030 - Usinfo.org
Annual Energy Outlook 2006 with Projections to 2030 - Usinfo.org
Annual Energy Outlook 2006 with Projections to 2030 - Usinfo.org

You also want an ePaper? Increase the reach of your titles
YUMPU automatically turns print PDFs into web optimized ePapers that Google loves.
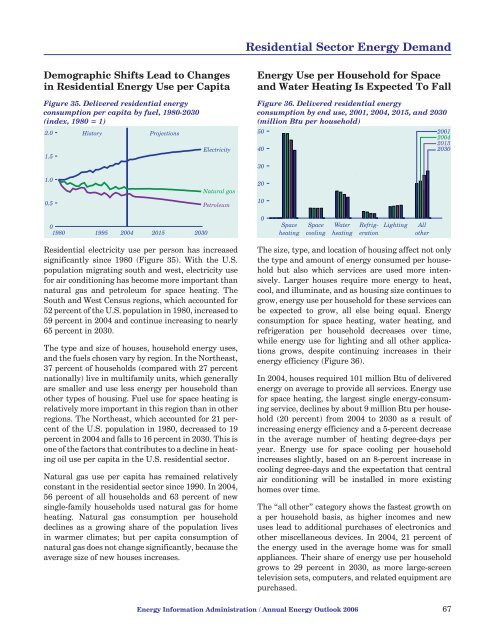
Residential Sec<strong>to</strong>r <strong>Energy</strong> DemandDemographic Shifts Lead <strong>to</strong> Changesin Residential <strong>Energy</strong> Use per CapitaFigure 35. Delivered residential energyconsumption per capita by fuel, 1980-<strong>2030</strong>(index, 1980 = 1)2.0 His<strong>to</strong>ry <strong>Projections</strong>1.5Electricity<strong>Energy</strong> Use per Household for Spaceand Water Heating Is Expected To FallFigure 36. Delivered residential energyconsumption by end use, 2001, 2004, 2015, and <strong>2030</strong>(million Btu per household)50 20012004201540<strong>2030</strong>301.00.5Natural gasPetroleum20100.01980 1995 2004 2015 <strong>2030</strong>0SpaceheatingSpacecoolingWaterheatingRefrigerationLightingAllotherResidential electricity use per person has increasedsignificantly since 1980 (Figure 35). With the U.S.population migrating south and west, electricity usefor air conditioning has become more important thannatural gas and petroleum for space heating. TheSouth and West Census regions, which accounted for52 percent of the U.S. population in 1980, increased <strong>to</strong>59 percent in 2004 and continue increasing <strong>to</strong> nearly65 percent in <strong>2030</strong>.The type and size of houses, household energy uses,and the fuels chosen vary by region. In the Northeast,37 percent of households (compared <strong>with</strong> 27 percentnationally) live in multifamily units, which generallyare smaller and use less energy per household thanother types of housing. Fuel use for space heating isrelatively more important in this region than in otherregions. The Northeast, which accounted for 21 percen<strong>to</strong>f the U.S. population in 1980, decreased <strong>to</strong> 19percent in 2004 and falls <strong>to</strong> 16 percent in <strong>2030</strong>. This isone of the fac<strong>to</strong>rs that contributes <strong>to</strong> a decline in heatingoil use per capita in the U.S. residential sec<strong>to</strong>r.Natural gas use per capita has remained relativelyconstant in the residential sec<strong>to</strong>r since 1990. In 2004,56 percent of all households and 63 percent of newsingle-family households used natural gas for homeheating. Natural gas consumption per householddeclines as a growing share of the population livesin warmer climates; but per capita consumption ofnatural gas does not change significantly, because theaverage size of new houses increases.The size, type, and location of housing affect not onlythe type and amount of energy consumed per householdbut also which services are used more intensively.Larger houses require more energy <strong>to</strong> heat,cool, and illuminate, and as housing size continues <strong>to</strong>grow, energy use per household for these services canbe expected <strong>to</strong> grow, all else being equal. <strong>Energy</strong>consumption for space heating, water heating, andrefrigeration per household decreases over time,while energy use for lighting and all other applicationsgrows, despite continuing increases in theirenergy efficiency (Figure 36).In 2004, houses required 101 million Btu of deliveredenergy on average <strong>to</strong> provide all services. <strong>Energy</strong> usefor space heating, the largest single energy-consumingservice, declines by about 9 million Btu per household(20 percent) from 2004 <strong>to</strong> <strong>2030</strong> as a result ofincreasing energy efficiency and a 5-percent decreasein the average number of heating degree-days peryear. <strong>Energy</strong> use for space cooling per householdincreases slightly, based on an 8-percent increase incooling degree-days and the expectation that centralair conditioning will be installed in more existinghomes over time.The “all other” category shows the fastest growth ona per household basis, as higher incomes and newuses lead <strong>to</strong> additional purchases of electronics andother miscellaneous devices. In 2004, 21 percent ofthe energy used in the average home was for smallappliances. Their share of energy use per householdgrows <strong>to</strong> 29 percent in <strong>2030</strong>, as more large-screentelevision sets, computers, and related equipment arepurchased.<strong>Energy</strong> Information Administration / <strong>Annual</strong> <strong>Energy</strong> <strong>Outlook</strong> <strong>2006</strong> 67


