

Annual Energy Outlook 2006 with Projections to 2030 - Usinfo.org
Annual Energy Outlook 2006 with Projections to 2030 - Usinfo.org
Annual Energy Outlook 2006 with Projections to 2030 - Usinfo.org

You also want an ePaper? Increase the reach of your titles
YUMPU automatically turns print PDFs into web optimized ePapers that Google loves.
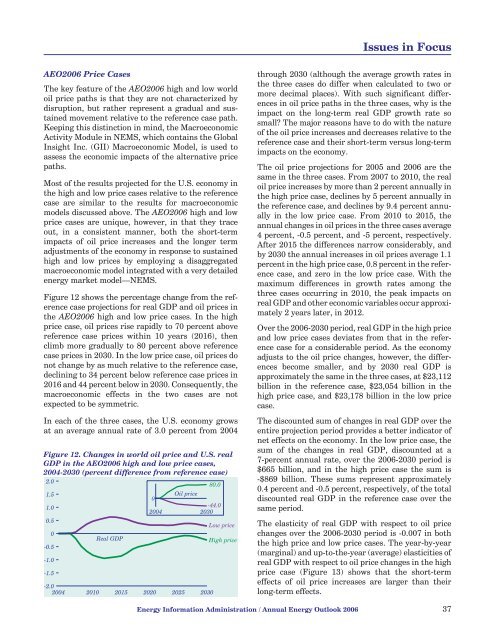
Issues in FocusAEO<strong>2006</strong> Price CasesThe key feature of the AEO<strong>2006</strong> high and low worldoil price paths is that they are not characterized bydisruption, but rather represent a gradual and sustainedmovement relative <strong>to</strong> the reference case path.Keeping this distinction in mind, the MacroeconomicActivity Module in NEMS, which contains the GlobalInsight Inc. (GII) Macroeconomic Model, is used <strong>to</strong>assess the economic impacts of the alternative pricepaths.Most of the results projected for the U.S. economy inthe high and low price cases relative <strong>to</strong> the referencecase are similar <strong>to</strong> the results for macroeconomicmodels discussed above. The AEO<strong>2006</strong> high and lowprice cases are unique, however, in that they traceout, in a consistent manner, both the short-termimpacts of oil price increases and the longer termadjustments of the economy in response <strong>to</strong> sustainedhigh and low prices by employing a disaggregatedmacroeconomic model integrated <strong>with</strong> a very detailedenergy market model—NEMS.Figure 12 shows the percentage change from the referencecase projections for real GDP and oil prices inthe AEO<strong>2006</strong> high and low price cases. In the highprice case, oil prices rise rapidly <strong>to</strong> 70 percent abovereference case prices <strong>with</strong>in 10 years (2016), thenclimb more gradually <strong>to</strong> 80 percent above referencecase prices in <strong>2030</strong>. In the low price case, oil prices donot change by as much relative <strong>to</strong> the reference case,declining <strong>to</strong> 34 percent below reference case prices in2016 and 44 percent below in <strong>2030</strong>. Consequently, themacroeconomic effects in the two cases are notexpected <strong>to</strong> be symmetric.In each of the three cases, the U.S. economy growsat an average annual rate of 3.0 percent from 2004Figure 12. Changes in world oil price and U.S. realGDP in the AEO<strong>2006</strong> high and low price cases,2004-<strong>2030</strong> (percent difference from reference case)2.080.01.5Oil price01.0-44.02004 <strong>2030</strong>0.50.0-0.5-1.0-1.5Real GDP-2.02004 2010 2015 2020 2025 <strong>2030</strong>Low priceHigh pricethrough <strong>2030</strong> (although the average growth rates inthe three cases do differ when calculated <strong>to</strong> two ormore decimal places). With such significant differencesin oil price paths in the three cases, why is theimpact on the long-term real GDP growth rate sosmall? The major reasons have <strong>to</strong> do <strong>with</strong> the natureof the oil price increases and decreases relative <strong>to</strong> thereference case and their short-term versus long-termimpacts on the economy.The oil price projections for 2005 and <strong>2006</strong> are thesame in the three cases. From 2007 <strong>to</strong> 2010, the realoil price increases by more than 2 percent annually inthe high price case, declines by 5 percent annually inthe reference case, and declines by 9.4 percent annuallyin the low price case. From 2010 <strong>to</strong> 2015, theannual changes in oil prices in the three cases average4 percent, -0.5 percent, and -5 percent, respectively.After 2015 the differences narrow considerably, andby <strong>2030</strong> the annual increases in oil prices average 1.1percent in the high price case, 0.8 percent in the referencecase, and zero in the low price case. With themaximum differences in growth rates among thethree cases occurring in 2010, the peak impacts onreal GDP and other economic variables occur approximately2 years later, in 2012.Over the <strong>2006</strong>-<strong>2030</strong> period, real GDP in the high priceand low price cases deviates from that in the referencecase for a considerable period. As the economyadjusts <strong>to</strong> the oil price changes, however, the differencesbecome smaller, and by <strong>2030</strong> real GDP isapproximately the same in the three cases, at $23,112billion in the reference case, $23,054 billion in thehigh price case, and $23,178 billion in the low pricecase.The discounted sum of changes in real GDP over theentire projection period provides a better indica<strong>to</strong>r ofnet effects on the economy. In the low price case, thesum of the changes in real GDP, discounted at a7-percent annual rate, over the <strong>2006</strong>-<strong>2030</strong> period is$665 billion, and in the high price case the sum is-$869 billion. These sums represent approximately0.4 percent and -0.5 percent, respectively, of the <strong>to</strong>taldiscounted real GDP in the reference case over thesame period.The elasticity of real GDP <strong>with</strong> respect <strong>to</strong> oil pricechanges over the <strong>2006</strong>-<strong>2030</strong> period is -0.007 in boththe high price and low price cases. The year-by-year(marginal) and up-<strong>to</strong>-the-year (average) elasticities ofreal GDP <strong>with</strong> respect <strong>to</strong> oil price changes in the highprice case (Figure 13) shows that the short-termeffects of oil price increases are larger than theirlong-term effects.<strong>Energy</strong> Information Administration / <strong>Annual</strong> <strong>Energy</strong> <strong>Outlook</strong> <strong>2006</strong> 37


