

Annual Energy Outlook 2006 with Projections to 2030 - Usinfo.org
Annual Energy Outlook 2006 with Projections to 2030 - Usinfo.org
Annual Energy Outlook 2006 with Projections to 2030 - Usinfo.org

Create successful ePaper yourself
Turn your PDF publications into a flip-book with our unique Google optimized e-Paper software.
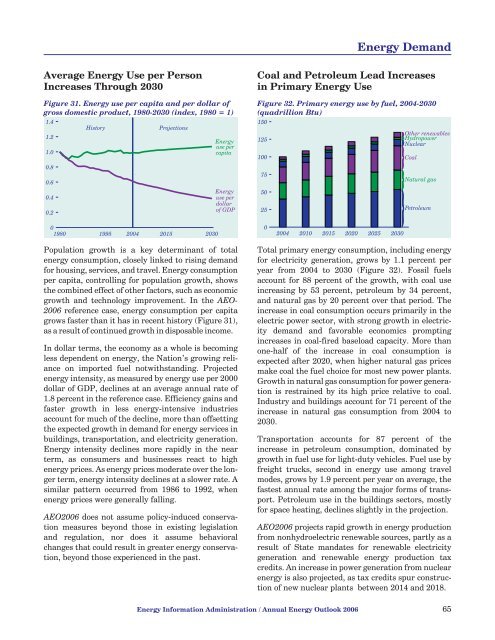
<strong>Energy</strong> DemandAverage <strong>Energy</strong> Use per PersonIncreases Through <strong>2030</strong>Figure 31. <strong>Energy</strong> use per capita and per dollar ofgross domestic product, 1980-<strong>2030</strong> (index, 1980 = 1)1.41.21.00.80.60.40.2His<strong>to</strong>ry<strong>Projections</strong><strong>Energy</strong>use percapita<strong>Energy</strong>use perdollarof GDPCoal and Petroleum Lead Increasesin Primary <strong>Energy</strong> UseFigure 32. Primary energy use by fuel, 2004-<strong>2030</strong>(quadrillion Btu)150125100755025Other renewablesHydropowerNuclearCoalNatural gasPetroleum0.01980 1995 2004 2015 <strong>2030</strong>02004 2010 2015 2020 2025 <strong>2030</strong>Population growth is a key determinant of <strong>to</strong>talenergy consumption, closely linked <strong>to</strong> rising demandfor housing, services, and travel. <strong>Energy</strong> consumptionper capita, controlling for population growth, showsthe combined effect of other fac<strong>to</strong>rs, such as economicgrowth and technology improvement. In the AEO-<strong>2006</strong> reference case, energy consumption per capitagrows faster than it has in recent his<strong>to</strong>ry (Figure 31),as a result of continued growth in disposable income.In dollar terms, the economy as a whole is becomingless dependent on energy, the Nation’s growing relianceon imported fuel not<strong>with</strong>standing. Projectedenergy intensity, as measured by energy use per 2000dollar of GDP, declines at an average annual rate of1.8 percent in the reference case. Efficiency gains andfaster growth in less energy-intensive industriesaccount for much of the decline, more than offsettingthe expected growth in demand for energy services inbuildings, transportation, and electricity generation.<strong>Energy</strong> intensity declines more rapidly in the nearterm, as consumers and businesses react <strong>to</strong> highenergy prices. As energy prices moderate over the longerterm, energy intensity declines at a slower rate. Asimilar pattern occurred from 1986 <strong>to</strong> 1992, whenenergy prices were generally falling.AEO<strong>2006</strong> does not assume policy-induced conservationmeasures beyond those in existing legislationand regulation, nor does it assume behavioralchanges that could result in greater energy conservation,beyond those experienced in the past.Total primary energy consumption, including energyfor electricity generation, grows by 1.1 percent peryear from 2004 <strong>to</strong> <strong>2030</strong> (Figure 32). Fossil fuelsaccount for 88 percent of the growth, <strong>with</strong> coal useincreasing by 53 percent, petroleum by 34 percent,and natural gas by 20 percent over that period. Theincrease in coal consumption occurs primarily in theelectric power sec<strong>to</strong>r, <strong>with</strong> strong growth in electricitydemand and favorable economics promptingincreases in coal-fired baseload capacity. More thanone-half of the increase in coal consumption isexpected after 2020, when higher natural gas pricesmake coal the fuel choice for most new power plants.Growth in natural gas consumption for power generationis restrained by its high price relative <strong>to</strong> coal.Industry and buildings account for 71 percent of theincrease in natural gas consumption from 2004 <strong>to</strong><strong>2030</strong>.Transportation accounts for 87 percent of theincrease in petroleum consumption, dominated bygrowth in fuel use for light-duty vehicles. Fuel use byfreight trucks, second in energy use among travelmodes, grows by 1.9 percent per year on average, thefastest annual rate among the major forms of transport.Petroleum use in the buildings sec<strong>to</strong>rs, mostlyfor space heating, declines slightly in the projection.AEO<strong>2006</strong> projects rapid growth in energy productionfrom nonhydroelectric renewable sources, partly as aresult of State mandates for renewable electricitygeneration and renewable energy production taxcredits. An increase in power generation from nuclearenergy is also projected, as tax credits spur constructionof new nuclear plants between 2014 and 2018.<strong>Energy</strong> Information Administration / <strong>Annual</strong> <strong>Energy</strong> <strong>Outlook</strong> <strong>2006</strong> 65


