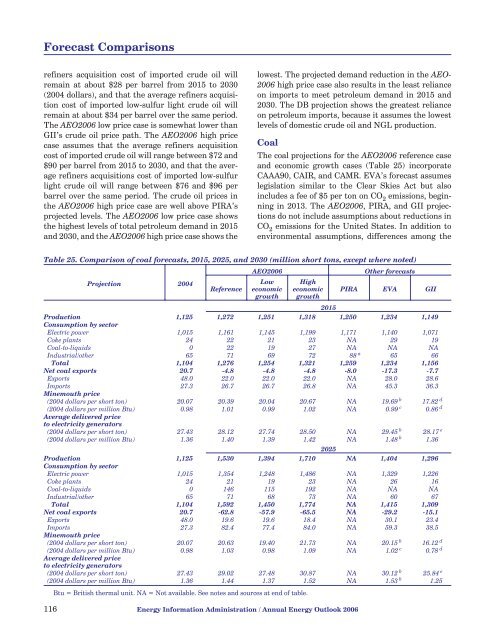
Forecast Comparisonsrefiners acquisition cost of imported crude oil willremain at about $28 per barrel from 2015 <strong>to</strong> <strong>2030</strong>(2004 dollars), and that the average refiners acquisitioncost of imported low-sulfur light crude oil willremain at about $34 per barrel over the same period.The AEO<strong>2006</strong> low price case is somewhat lower thanGII’s crude oil price path. The AEO<strong>2006</strong> high pricecase assumes that the average refiners acquisitioncost of imported crude oil will range between $72 and$90 per barrel from 2015 <strong>to</strong> <strong>2030</strong>, and that the averagerefiners acquisitions cost of imported low-sulfurlight crude oil will range between $76 and $96 perbarrel over the same period. The crude oil prices inthe AEO<strong>2006</strong> high price case are well above PIRA’sprojected levels. The AEO<strong>2006</strong> low price case showsthe highest levels of <strong>to</strong>tal petroleum demand in 2015and <strong>2030</strong>, and the AEO<strong>2006</strong> high price case shows thelowest. The projected demand reduction in the AEO-<strong>2006</strong> high price case also results in the least relianceon imports <strong>to</strong> meet petroleum demand in 2015 and<strong>2030</strong>. The DB projection shows the greatest relianceon petroleum imports, because it assumes the lowestlevels of domestic crude oil and NGL production.CoalThe coal projections for the AEO<strong>2006</strong> reference caseand economic growth cases (Table 25) incorporateCAAA90, CAIR, and CAMR. EVA’s forecast assumeslegislation similar <strong>to</strong> the Clear Skies Act but alsoincludes a fee of $5 per <strong>to</strong>n on CO 2 emissions, beginningin 2013. The AEO<strong>2006</strong>, PIRA, and GII projectionsdo not include assumptions about reductions inCO 2 emissions for the United States. In addition <strong>to</strong>environmental assumptions, differences among theTable 25. Comparison of coal forecasts, 2015, 2025, and <strong>2030</strong> (million short <strong>to</strong>ns, except where noted)Projection 2004ReferenceAEO<strong>2006</strong>LoweconomicgrowthHigheconomicgrowth116 <strong>Energy</strong> Information Administration / <strong>Annual</strong> <strong>Energy</strong> <strong>Outlook</strong> <strong>2006</strong>Other forecastsPIRA EVA GII2015Production 1,125 1,272 1,251 1,318 1,250 1,234 1,149Consumption by sec<strong>to</strong>rElectric power 1,015 1,161 1,145 1,199 1,171 1,140 1,071Coke plants 24 22 21 23 NA 29 19Coal-<strong>to</strong>-liquids 0 22 19 27 NA NA NAIndustrial/other 65 71 69 72 88 a 65 66Total 1,104 1,276 1,254 1,321 1,259 1,234 1,156Net coal exports 20.7 -4.8 -4.8 -4.8 -8.0 -17.3 -7.7Exports 48.0 22.0 22.0 22.0 NA 28.0 28.6Imports 27.3 26.7 26.7 26.8 NA 45.3 36.3Minemouth price(2004 dollars per short <strong>to</strong>n) 20.07 20.39 20.04 20.67 NA 19.69 b 17.82 d(2004 dollars per million Btu) 0.98 1.01 0.99 1.02 NA 0.99 c 0.86 dAverage delivered price<strong>to</strong> electricity genera<strong>to</strong>rs(2004 dollars per short <strong>to</strong>n) 27.43 28.12 27.74 28.50 NA 29.45 b 28.17 e(2004 dollars per million Btu) 1.36 1.40 1.39 1.42 NA 1.48 b 1.362025Production 1,125 1,530 1,394 1,710 NA 1,404 1,296Consumption by sec<strong>to</strong>rElectric power 1,015 1,354 1,248 1,486 NA 1,329 1,226Coke plants 24 21 19 23 NA 26 16Coal-<strong>to</strong>-liquids 0 146 115 192 NA NA NAIndustrial/other 65 71 68 73 NA 60 67Total 1,104 1,592 1,450 1,774 NA 1,415 1,309Net coal exports 20.7 -62.8 -57.9 -65.5 NA -29.2 -15.1Exports 48.0 19.6 19.6 18.4 NA 30.1 23.4Imports 27.3 82.4 77.4 84.0 NA 59.3 38.5Minemouth price(2004 dollars per short <strong>to</strong>n) 20.07 20.63 19.40 21.73 NA 20.15 b 16.12 d(2004 dollars per million Btu) 0.98 1.03 0.98 1.09 NA 1.02 c 0.78 dAverage delivered price<strong>to</strong> electricity genera<strong>to</strong>rs(2004 dollars per short <strong>to</strong>n) 27.43 29.02 27.48 30.87 NA 30.12 b 25.84 e(2004 dollars per million Btu) 1.36 1.44 1.37 1.52 NA 1.53 b 1.25Btu = British thermal unit. NA = Not available. See notes and sources at end of table.
Forecast ComparisonsAEO<strong>2006</strong>, EVA, PIRA, and GII projections reflectvariation in other assumptions, including those abouteconomic growth, the natural gas outlook, and worldoil prices.While all the projections show increases in coal consumptionover their projection horizons, theAEO<strong>2006</strong> reference case projects the highest level of<strong>to</strong>tal coal consumption. Given its more restrictiveenvironmental assumptions after 2012 and an averageeconomic growth rate of 2.5 percent per year from2004, EVA projects lower levels of coal consumption(11 percent lower in 2025) than the AEO<strong>2006</strong> referencecase. The EVA and PIRA projections for <strong>to</strong>talcoal consumption in the 2015-2020 period mostclosely resemble those in the AEO<strong>2006</strong> low economicgrowth case. GII’s projection, which does not includea carbon tax, has the lowest projection of <strong>to</strong>tal coalconsumption. Although the GII projection shows 21percent less <strong>to</strong>tal coal consumption than theAEO<strong>2006</strong> reference case in <strong>2030</strong>, GII’s outlook forcoal consumption in the electric power sec<strong>to</strong>r in <strong>2030</strong>is virtually identical <strong>to</strong> that in the AEO<strong>2006</strong> low economicgrowth case.In contrast <strong>to</strong> the AEO<strong>2006</strong> reference case, the otherprojections show natural gas <strong>with</strong> a larger share ofelectricity generation than coal’s. GII, PIRA, andEVA expect imports of LNG <strong>to</strong> be greater than projectedin the AEO<strong>2006</strong> reference case. Although EVAand the AEO<strong>2006</strong> reference case project similar levelsof generation in the electric power sec<strong>to</strong>r, theAEO<strong>2006</strong> reference case also projects 19 gigawatts ofgeneration capacity at CTL plants by <strong>2030</strong>, representing11 percent of <strong>to</strong>tal coal consumption in <strong>2030</strong>.For coke plants, both GII and the AEO<strong>2006</strong> referencecase project declining consumption of coal. EVA differsfrom the other projections and projects anincrease in coal consumption at coke plants, peakingat around 30 million <strong>to</strong>ns before falling <strong>to</strong> 26 million<strong>to</strong>ns in 2025—2 million <strong>to</strong>ns higher than 2004Table 25. Comparison of coal forecasts, 2015, 2025, and <strong>2030</strong> (continued)(million short <strong>to</strong>ns, except where noted)Projection 2004ReferenceAEO<strong>2006</strong>LoweconomicgrowthHigheconomicgrowthOther forecastsPIRA EVA GII<strong>2030</strong>Production 1,125 1,703 1,497 1,936 NA NA 1,395Consumption by sec<strong>to</strong>rElectric power 1,015 1,502 1,331 1,680 NA NA 1,330Coke plants 24 21 19 23 NA NA 14Coal-<strong>to</strong>-liquids 0 190 153 247 NA NA NAIndustrial/other 65 72 68 75 NA NA 67Total 1,104 1,784 1,571 2,025 NA NA 1,411Net coal exports 20.7 -82.7 -69.3 -89.0 NA NA -18.7Exports 48.0 16.7 16.4 16.8 NA NA 22.3Imports 27.3 99.4 85.7 105.8 NA NA 41.0Minemouth price(2004 dollars per short <strong>to</strong>n) 20.07 21.73 19.91 23.05 NA NA 15.65 d(2004 dollars per million Btu) 0.98 1.09 1.00 1.15 NA NA 0.76 dAverage delivered price<strong>to</strong> electricity genera<strong>to</strong>rs(2004 dollars per short <strong>to</strong>n) 27.43 30.58 28.28 32.79 NA NA 25.23 e(2004 dollars per million Btu) 1.36 1.51 1.41 1.61 NA NA 1.22Btu = British thermal unit. NA = Not available.a Includes coal consumed at coke plants.b The average coal price is a weighted average of the projected spot market price for the electric power sec<strong>to</strong>r only and was converted from2005 dollars <strong>to</strong> 2004 dollars <strong>to</strong> be consistent <strong>with</strong> AEO<strong>2006</strong>.c Estimated by dividing the minemouth price in dollars per short <strong>to</strong>n by the average heat content of coal delivered <strong>to</strong> the electric powersec<strong>to</strong>r.d The minemouth prices are average prices for the electric power sec<strong>to</strong>r only and are calculated as a weighted average from Census regionprices.e Calculated by multiplying the delivered price of coal <strong>to</strong> the electric power sec<strong>to</strong>r in dollars per million Btu by the average heat content ofcoal delivered <strong>to</strong> the electric power sec<strong>to</strong>r.Sources: 2004 and AEO<strong>2006</strong>: AEO<strong>2006</strong> National <strong>Energy</strong> Modeling System, runs AEO<strong>2006</strong>.D111905A (reference case), LM<strong>2006</strong>.D113005A (low economic growth case), and HM<strong>2006</strong>.D112505B (high economic growth case). PIRA: PIRA <strong>Energy</strong> Group (Oc<strong>to</strong>ber 2005).EVA: <strong>Energy</strong> Ventures Analysis, Inc., FUELCAST: Long-Term <strong>Outlook</strong> (August 2005). GII: Global Insight, Inc., U.S. <strong>Energy</strong> <strong>Outlook</strong>(Summer 2005).<strong>Energy</strong> Information Administration / <strong>Annual</strong> <strong>Energy</strong> <strong>Outlook</strong> <strong>2006</strong> 117