

Annual Energy Outlook 2006 with Projections to 2030 - Usinfo.org
Annual Energy Outlook 2006 with Projections to 2030 - Usinfo.org
Annual Energy Outlook 2006 with Projections to 2030 - Usinfo.org

You also want an ePaper? Increase the reach of your titles
YUMPU automatically turns print PDFs into web optimized ePapers that Google loves.
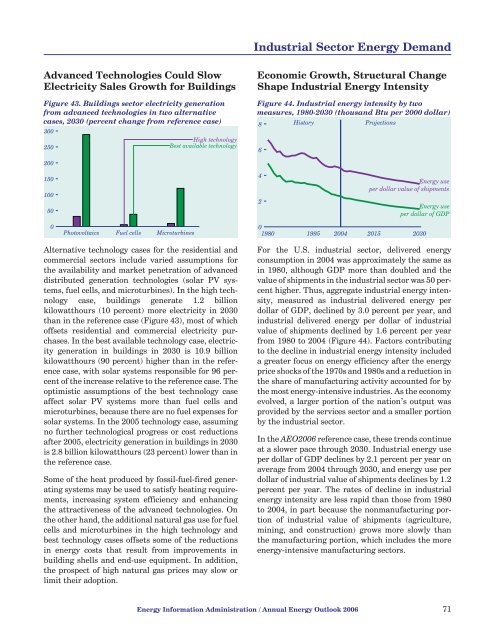
Industrial Sec<strong>to</strong>r <strong>Energy</strong> DemandAdvanced Technologies Could SlowElectricity Sales Growth for BuildingsFigure 43. Buildings sec<strong>to</strong>r electricity generationfrom advanced technologies in two alternativecases, <strong>2030</strong> (percent change from reference case)300250High technologyBest available technologyEconomic Growth, Structural ChangeShape Industrial <strong>Energy</strong> IntensityFigure 44. Industrial energy intensity by twomeasures, 1980-<strong>2030</strong> (thousand Btu per 2000 dollar)8 His<strong>to</strong>ry <strong>Projections</strong>62001501005042<strong>Energy</strong> useper dollar value of shipments<strong>Energy</strong> useperdollarofGDP0Pho<strong>to</strong>voltaics Fuel cells Microturbines01980 1995 2004 2015 <strong>2030</strong>Alternative technology cases for the residential andcommercial sec<strong>to</strong>rs include varied assumptions forthe availability and market penetration of advanceddistributed generation technologies (solar PV systems,fuel cells, and microturbines). In the high technologycase, buildings generate 1.2 billionkilowatthours (10 percent) more electricity in <strong>2030</strong>than in the reference case (Figure 43), most of whichoffsets residential and commercial electricity purchases.In the best available technology case, electricitygeneration in buildings in <strong>2030</strong> is 10.9 billionkilowatthours (90 percent) higher than in the referencecase, <strong>with</strong> solar systems responsible for 96 percen<strong>to</strong>f the increase relative <strong>to</strong> the reference case. Theoptimistic assumptions of the best technology caseaffect solar PV systems more than fuel cells andmicroturbines, because there are no fuel expenses forsolar systems. In the 2005 technology case, assumingno further technological progress or cost reductionsafter 2005, electricity generation in buildings in <strong>2030</strong>is 2.8 billion kilowatthours (23 percent) lower than inthe reference case.Some of the heat produced by fossil-fuel-fired generatingsystems may be used <strong>to</strong> satisfy heating requirements,increasing system efficiency and enhancingthe attractiveness of the advanced technologies. Onthe other hand, the additional natural gas use for fuelcells and microturbines in the high technology andbest technology cases offsets some of the reductionsin energy costs that result from improvements inbuilding shells and end-use equipment. In addition,the prospect of high natural gas prices may slow orlimit their adoption.For the U.S. industrial sec<strong>to</strong>r, delivered energyconsumption in 2004 was approximately the same asin 1980, although GDP more than doubled and thevalue of shipments in the industrial sec<strong>to</strong>r was 50 percenthigher. Thus, aggregate industrial energy intensity,measured as industrial delivered energy perdollar of GDP, declined by 3.0 percent per year, andindustrial delivered energy per dollar of industrialvalue of shipments declined by 1.6 percent per yearfrom 1980 <strong>to</strong> 2004 (Figure 44). Fac<strong>to</strong>rs contributing<strong>to</strong> the decline in industrial energy intensity includeda greater focus on energy efficiency after the energyprice shocks of the 1970s and 1980s and a reduction inthe share of manufacturing activity accounted for bythe most energy-intensive industries. As the economyevolved, a larger portion of the nation’s output wasprovided by the services sec<strong>to</strong>r and a smaller portionby the industrial sec<strong>to</strong>r.In the AEO<strong>2006</strong> reference case, these trends continueat a slower pace through <strong>2030</strong>. Industrial energy useper dollar of GDP declines by 2.1 percent per year onaverage from 2004 through <strong>2030</strong>, and energy use perdollar of industrial value of shipments declines by 1.2percent per year. The rates of decline in industrialenergy intensity are less rapid than those from 1980<strong>to</strong> 2004, in part because the nonmanufacturing portionof industrial value of shipments (agriculture,mining, and construction) grows more slowly thanthe manufacturing portion, which includes the moreenergy-intensive manufacturing sec<strong>to</strong>rs.<strong>Energy</strong> Information Administration / <strong>Annual</strong> <strong>Energy</strong> <strong>Outlook</strong> <strong>2006</strong> 71


