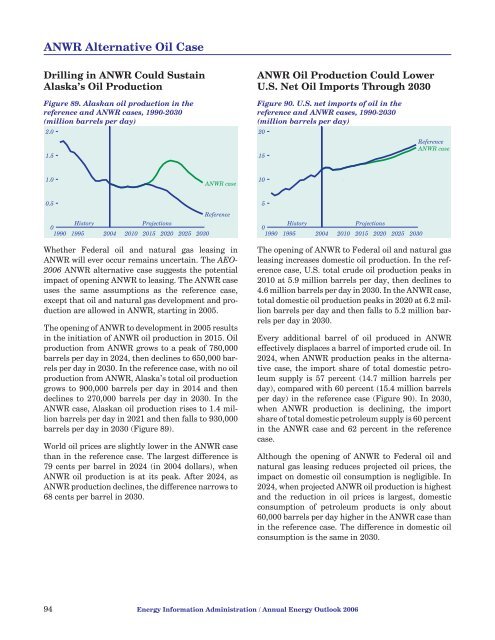
ANWR Alternative Oil CaseDrilling in ANWR Could SustainAlaska’s Oil ProductionANWR Oil Production Could LowerU.S. Net Oil Imports Through <strong>2030</strong>Figure 89. Alaskan oil production in thereference and ANWR cases, 1990-<strong>2030</strong>(million barrels per day)2.01.5Figure 90. U.S. net imports of oil in thereference and ANWR cases, 1990-<strong>2030</strong>(million barrels per day)2015ReferenceANWR case1.0ANWR case100.5His<strong>to</strong>ry<strong>Projections</strong>0.01990 1995 2004 2010 2015 2020 2025 <strong>2030</strong>ReferenceWhether Federal oil and natural gas leasing inANWR will ever occur remains uncertain. The AEO-<strong>2006</strong> ANWR alternative case suggests the potentialimpact of opening ANWR <strong>to</strong> leasing. The ANWR caseuses the same assumptions as the reference case,except that oil and natural gas development and productionare allowed in ANWR, starting in 2005.The opening of ANWR <strong>to</strong> development in 2005 resultsin the initiation of ANWR oil production in 2015. Oilproduction from ANWR grows <strong>to</strong> a peak of 780,000barrels per day in 2024, then declines <strong>to</strong> 650,000 barrelsper day in <strong>2030</strong>. In the reference case, <strong>with</strong> no oilproduction from ANWR, Alaska’s <strong>to</strong>tal oil productiongrows <strong>to</strong> 900,000 barrels per day in 2014 and thendeclines <strong>to</strong> 270,000 barrels per day in <strong>2030</strong>. In theANWR case, Alaskan oil production rises <strong>to</strong> 1.4 millionbarrels per day in 2021 and then falls <strong>to</strong> 930,000barrels per day in <strong>2030</strong> (Figure 89).World oil prices are slightly lower in the ANWR casethan in the reference case. The largest difference is79 cents per barrel in 2024 (in 2004 dollars), whenANWR oil production is at its peak. After 2024, asANWR production declines, the difference narrows <strong>to</strong>68 cents per barrel in <strong>2030</strong>.5His<strong>to</strong>ry<strong>Projections</strong>01990 1995 2004 2010 2015 2020 2025 <strong>2030</strong>The opening of ANWR <strong>to</strong> Federal oil and natural gasleasing increases domestic oil production. In the referencecase, U.S. <strong>to</strong>tal crude oil production peaks in2010 at 5.9 million barrels per day, then declines <strong>to</strong>4.6 million barrels per day in <strong>2030</strong>. In the ANWR case,<strong>to</strong>tal domestic oil production peaks in 2020 at 6.2 millionbarrels per day and then falls <strong>to</strong> 5.2 million barrelsper day in <strong>2030</strong>.Every additional barrel of oil produced in ANWReffectively displaces a barrel of imported crude oil. In2024, when ANWR production peaks in the alternativecase, the import share of <strong>to</strong>tal domestic petroleumsupply is 57 percent (14.7 million barrels perday), compared <strong>with</strong> 60 percent (15.4 million barrelsper day) in the reference case (Figure 90). In <strong>2030</strong>,when ANWR production is declining, the importshare of <strong>to</strong>tal domestic petroleum supply is 60 percentin the ANWR case and 62 percent in the referencecase.Although the opening of ANWR <strong>to</strong> Federal oil andnatural gas leasing reduces projected oil prices, theimpact on domestic oil consumption is negligible. In2024, when projected ANWR oil production is highestand the reduction in oil prices is largest, domesticconsumption of petroleum products is only about60,000 barrels per day higher in the ANWR case thanin the reference case. The difference in domestic oilconsumption is the same in <strong>2030</strong>.94 <strong>Energy</strong> Information Administration / <strong>Annual</strong> <strong>Energy</strong> <strong>Outlook</strong> <strong>2006</strong>
Refined Petroleum ProductsTransportation Uses Lead Growthin Petroleum ConsumptionFigure 91. Consumption of petroleum products,1990-<strong>2030</strong> (million barrels per day)3025201510His<strong>to</strong>ry<strong>Projections</strong>TotalMo<strong>to</strong>rgasolineExpansion at Existing RefineriesIncreases U.S. Refining CapacityFigure 92. Domestic refinery distillation capacity,1990-<strong>2030</strong> (million barrels per day)2520151015.7His<strong>to</strong>ry16.9<strong>Projections</strong>17.6 17.9 18.1 18.519.35OtherDistillateJet fuel0Residual1990 1995 2004 2010 2015 2020 2025 <strong>2030</strong>501990 2004 2010 2015 2020 2025 <strong>2030</strong>Between 70 and 74 percent of U.S. petroleum use isfor transportation, and much of the projected growthin domestic consumption reflects growth in the use oftransportation fuels (Figure 91). Gasoline, distillatefuel (ultra-low-sulfur diesel), and jet fuel are the maintransportation fuels. In the AEO<strong>2006</strong> reference case,improvements in technology increase the efficiency ofmo<strong>to</strong>r vehicles and aircraft, but growth in demand foreach mode of transit far outpaces increases in fuelefficiency, as transportation demand grows in proportion<strong>to</strong> increases in population and GDP.In the residential sec<strong>to</strong>r, the use of distillate for homeheating declines as natural gas and LPG are usedincreasingly as substitutes. Both burn more cleanlythan distillate, eliminating the annual maintenancethat is needed for an oil-fired furnace or boiler. Naturalgas, where available, is more convenient than distillateor LPG.In the industrial and commercial sec<strong>to</strong>rs, distillate isused as a fuel for heating and for diesel engines. In thenear term, high prices for distillate lead <strong>to</strong> fuelswitching away from heating oil; but as prices moderate,there is some switching back <strong>to</strong> distillate forheating uses.Residual fuel is blended from the heaviest crude oilcomponents. Undiluted residual fuel is used <strong>to</strong> powerships and electricity plants. Residual fuel diluted <strong>with</strong>distillate is used <strong>to</strong> fire boilers and <strong>to</strong> power somelocomotives. Residual fuel consumption declinesin the reference case as environmental restrictionstighten, and because refiners find it more attractive<strong>to</strong> upgrade residual fuel <strong>to</strong> lighter products.Distillation capacity at U.S. refineries expands in thereference case (Figure 92) as demand for refinedpetroleum products increases. More than 30 yearshave passed since a new U.S. refinery was built, andmost of the expansion occurs at existing sites. Althoughit is not difficult technically for refiners andrefinery process developers <strong>to</strong> expand the capacity ofexisting units, obtaining permits is difficult, and gettingpermits <strong>to</strong> build a new refinery is even harder.Nonetheless, a startup company has announced plans<strong>to</strong> open a major new refinery in Arizona in 2010.The most basic refinery operation is atmosphericdistillation of crude oil. Crude oil is heated <strong>to</strong> about750 degrees Fahrenheit and then fed in<strong>to</strong> a <strong>to</strong>werwhere it separates in<strong>to</strong> fractions according <strong>to</strong> the boilingpoints of the many compounds it contains. Theseparated fractions are sent on <strong>to</strong> other units inthe refinery for further processing and, ultimately,blending in<strong>to</strong> finished products.Other processing units in a refinery generally expandat about the same rate as distillation capacity; however,tighter product specifications, poorer crude oilquality, and dwindling demand for residual fuelincrease the capacity needed for two processes, cokingand hydrotreating. Coking is used <strong>to</strong> break the heaviestfractions of crude oil in<strong>to</strong> elemental carbon, orcoke, and lighter fractions. Material used in the cokerwould otherwise be usable only as residual fuel orasphalt. Hydrotreating capacity, which is used <strong>to</strong> takesulfur out of petroleum products, allows refiners <strong>to</strong>meet tighter limits on sulfur content and <strong>to</strong> runhigher sulfur crude oils through their refineries.<strong>Energy</strong> Information Administration / <strong>Annual</strong> <strong>Energy</strong> <strong>Outlook</strong> <strong>2006</strong> 95