

Annual Energy Outlook 2006 with Projections to 2030 - Usinfo.org
Annual Energy Outlook 2006 with Projections to 2030 - Usinfo.org
Annual Energy Outlook 2006 with Projections to 2030 - Usinfo.org

You also want an ePaper? Increase the reach of your titles
YUMPU automatically turns print PDFs into web optimized ePapers that Google loves.
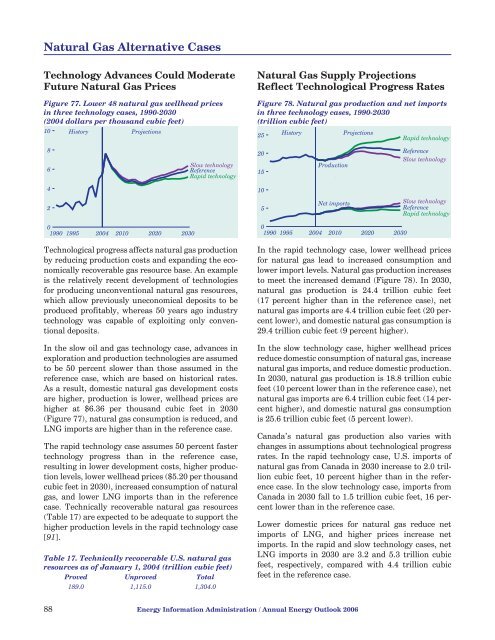
Natural Gas Alternative CasesTechnology Advances Could ModerateFuture Natural Gas PricesFigure 77. Lower 48 natural gas wellhead pricesin three technology cases, 1990-<strong>2030</strong>(2004 dollars per thousand cubic feet)10His<strong>to</strong>ry<strong>Projections</strong>Natural Gas Supply <strong>Projections</strong>Reflect Technological Progress RatesFigure 78. Natural gas production and net importsin three technology cases, 1990-<strong>2030</strong>(trillion cubic feet)25His<strong>to</strong>ry<strong>Projections</strong>Rapid technology86Slow technologyReferenceRapid technology2015ProductionReferenceSlow technology41025Net importsSlow technologyReferenceRapid technology01990 1995 2004 2010 2020 <strong>2030</strong>Technological progress affects natural gas productionby reducing production costs and expanding the economicallyrecoverable gas resource base. An exampleis the relatively recent development of technologiesfor producing unconventional natural gas resources,which allow previously uneconomical deposits <strong>to</strong> beproduced profitably, whereas 50 years ago industrytechnology was capable of exploiting only conventionaldeposits.In the slow oil and gas technology case, advances inexploration and production technologies are assumed<strong>to</strong> be 50 percent slower than those assumed in thereference case, which are based on his<strong>to</strong>rical rates.As a result, domestic natural gas development costsare higher, production is lower, wellhead prices arehigher at $6.36 per thousand cubic feet in <strong>2030</strong>(Figure 77), natural gas consumption is reduced, andLNG imports are higher than in the reference case.The rapid technology case assumes 50 percent fastertechnology progress than in the reference case,resulting in lower development costs, higher productionlevels, lower wellhead prices ($5.20 per thousandcubic feet in <strong>2030</strong>), increased consumption of naturalgas, and lower LNG imports than in the referencecase. Technically recoverable natural gas resources(Table 17) are expected <strong>to</strong> be adequate <strong>to</strong> support thehigher production levels in the rapid technology case[91].Table 17. Technically recoverable U.S. natural gasresources as of January 1, 2004 (trillion cubic feet)Proved Unproved Total189.0 1,115.0 1,304.001990 1995 2004 2010 2020 <strong>2030</strong>In the rapid technology case, lower wellhead pricesfor natural gas lead <strong>to</strong> increased consumption andlower import levels. Natural gas production increases<strong>to</strong> meet the increased demand (Figure 78). In <strong>2030</strong>,natural gas production is 24.4 trillion cubic feet(17 percent higher than in the reference case), netnatural gas imports are 4.4 trillion cubic feet (20 percentlower), and domestic natural gas consumption is29.4 trillion cubic feet (9 percent higher).In the slow technology case, higher wellhead pricesreduce domestic consumption of natural gas, increasenatural gas imports, and reduce domestic production.In <strong>2030</strong>, natural gas production is 18.8 trillion cubicfeet (10 percent lower than in the reference case), netnatural gas imports are 6.4 trillion cubic feet (14 percenthigher), and domestic natural gas consumptionis 25.6 trillion cubic feet (5 percent lower).Canada’s natural gas production also varies <strong>with</strong>changes in assumptions about technological progressrates. In the rapid technology case, U.S. imports ofnatural gas from Canada in <strong>2030</strong> increase <strong>to</strong> 2.0 trillioncubic feet, 10 percent higher than in the referencecase. In the slow technology case, imports fromCanada in <strong>2030</strong> fall <strong>to</strong> 1.5 trillion cubic feet, 16 percentlower than in the reference case.Lower domestic prices for natural gas reduce netimports of LNG, and higher prices increase netimports. In the rapid and slow technology cases, netLNG imports in <strong>2030</strong> are 3.2 and 5.3 trillion cubicfeet, respectively, compared <strong>with</strong> 4.4 trillion cubicfeet in the reference case.88 <strong>Energy</strong> Information Administration / <strong>Annual</strong> <strong>Energy</strong> <strong>Outlook</strong> <strong>2006</strong>


