

Annual Energy Outlook 2006 with Projections to 2030 - Usinfo.org
Annual Energy Outlook 2006 with Projections to 2030 - Usinfo.org
Annual Energy Outlook 2006 with Projections to 2030 - Usinfo.org

Create successful ePaper yourself
Turn your PDF publications into a flip-book with our unique Google optimized e-Paper software.
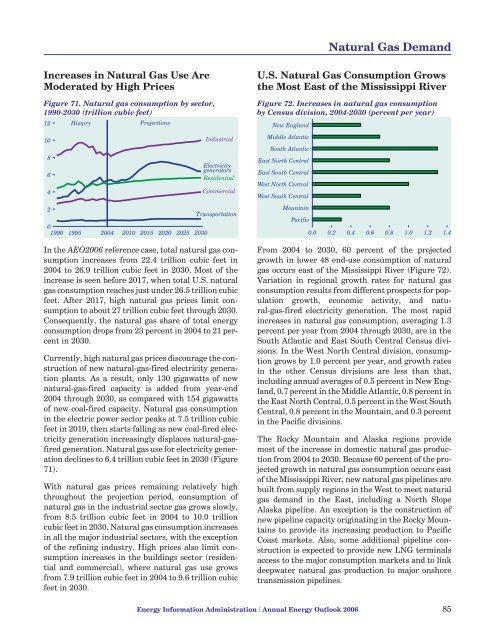
Natural Gas DemandIncreases in Natural Gas Use AreModerated by High PricesFigure 71. Natural gas consumption by sec<strong>to</strong>r,1990-<strong>2030</strong> (trillion cubic feet)12His<strong>to</strong>ry<strong>Projections</strong>U.S. Natural Gas Consumption Growsthe Most East of the Mississippi RiverFigure 72. Increases in natural gas consumptionby Census division, 2004-<strong>2030</strong> (percent per year)New England10864IndustrialElectricitygenera<strong>to</strong>rsResidentialCommercialMiddle AtlanticSouth AtlanticEast North CentralEast South CentralWest North CentralWest South Central201990 1995 2004 2010 2015 2020 2025 <strong>2030</strong>TransportationIn the AEO<strong>2006</strong> reference case, <strong>to</strong>tal natural gas consumptionincreases from 22.4 trillion cubic feet in2004 <strong>to</strong> 26.9 trillion cubic feet in <strong>2030</strong>. Most of theincrease is seen before 2017, when <strong>to</strong>tal U.S. naturalgas consumption reaches just under 26.5 trillion cubicfeet. After 2017, high natural gas prices limit consumption<strong>to</strong> about 27 trillion cubic feet through <strong>2030</strong>.Consequently, the natural gas share of <strong>to</strong>tal energyconsumption drops from 23 percent in 2004 <strong>to</strong> 21 percentin <strong>2030</strong>.Currently, high natural gas prices discourage the constructionof new natural-gas-fired electricity generationplants. As a result, only 130 gigawatts of newnatural-gas-fired capacity is added from year-end2004 through <strong>2030</strong>, as compared <strong>with</strong> 154 gigawattsof new coal-fired capacity. Natural gas consumptionin the electric power sec<strong>to</strong>r peaks at 7.5 trillion cubicfeet in 2019, then starts falling as new coal-fired electricitygeneration increasingly displaces natural-gasfiredgeneration. Natural gas use for electricity generationdeclines <strong>to</strong> 6.4 trillion cubic feet in <strong>2030</strong> (Figure71).With natural gas prices remaining relatively highthroughout the projection period, consumption ofnatural gas in the industrial sec<strong>to</strong>r gas grows slowly,from 8.5 trillion cubic feet in 2004 <strong>to</strong> 10.0 trillioncubic feet in <strong>2030</strong>. Natural gas consumption increasesin all the major industrial sec<strong>to</strong>rs, <strong>with</strong> the exceptionof the refining industry. High prices also limit consumptionincreases in the buildings sec<strong>to</strong>r (residentialand commercial), where natural gas use growsfrom 7.9 trillion cubic feet in 2004 <strong>to</strong> 9.6 trillion cubicfeet in <strong>2030</strong>.MountainPacific0.0 0.2 0.4 0.6 0.8 1.0 1.2 1.4From 2004 <strong>to</strong> <strong>2030</strong>, 60 percent of the projectedgrowth in lower 48 end-use consumption of naturalgas occurs east of the Mississippi River (Figure 72).Variation in regional growth rates for natural gasconsumption results from different prospects for populationgrowth, economic activity, and natural-gas-firedelectricity generation. The most rapidincreases in natural gas consumption, averaging 1.3percent per year from 2004 through <strong>2030</strong>, are in theSouth Atlantic and East South Central Census divisions.In the West North Central division, consumptiongrows by 1.0 percent per year, and growth ratesin the other Census divisions are less than that,including annual averages of 0.5 percent in New England,0.7 percent in the Middle Atlantic, 0.8 percent inthe East North Central, 0.5 percent in the West SouthCentral, 0.8 percent in the Mountain, and 0.3 percentin the Pacific divisions.The Rocky Mountain and Alaska regions providemost of the increase in domestic natural gas productionfrom 2004 <strong>to</strong> <strong>2030</strong>. Because 60 percent of the projectedgrowth in natural gas consumption occurs eas<strong>to</strong>f the Mississippi River, new natural gas pipelines arebuilt from supply regions in the West <strong>to</strong> meet naturalgas demand in the East, including a North SlopeAlaska pipeline. An exception is the construction ofnew pipeline capacity originating in the Rocky Mountains<strong>to</strong> provide its increasing production <strong>to</strong> PacificCoast markets. Also, some additional pipeline constructionis expected <strong>to</strong> provide new LNG terminalsaccess <strong>to</strong> the major consumption markets and <strong>to</strong> linkdeepwater natural gas production <strong>to</strong> major onshoretransmission pipelines.<strong>Energy</strong> Information Administration / <strong>Annual</strong> <strong>Energy</strong> <strong>Outlook</strong> <strong>2006</strong> 85


