

Annual Energy Outlook 2006 with Projections to 2030 - Usinfo.org
Annual Energy Outlook 2006 with Projections to 2030 - Usinfo.org
Annual Energy Outlook 2006 with Projections to 2030 - Usinfo.org

You also want an ePaper? Increase the reach of your titles
YUMPU automatically turns print PDFs into web optimized ePapers that Google loves.
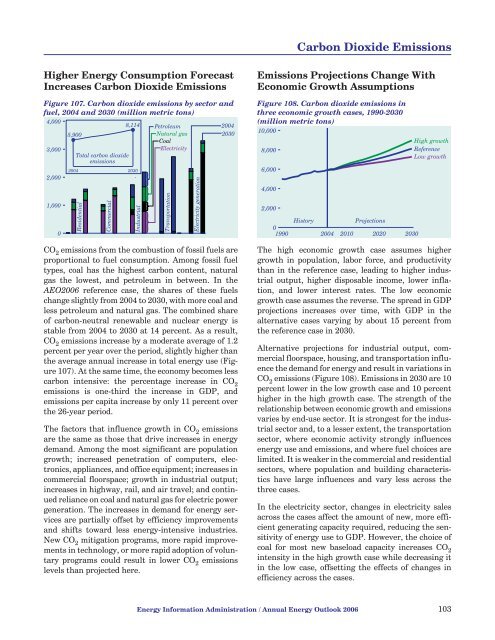
Carbon Dioxide EmissionsHigher <strong>Energy</strong> Consumption ForecastIncreases Carbon Dioxide EmissionsFigure 107. Carbon dioxide emissions by sec<strong>to</strong>r andfuel, 2004 and <strong>2030</strong> (million metric <strong>to</strong>ns)4,0008,114 Petroleum20045,900Natural gas<strong>2030</strong>Coal3,000ElectricityTotal carbon dioxideemissions2,0001,00002004 <strong>2030</strong>ResidentialCommercialIndustrialCO 2 emissions from the combustion of fossil fuels areproportional <strong>to</strong> fuel consumption. Among fossil fueltypes, coal has the highest carbon content, naturalgas the lowest, and petroleum in between. In theAEO<strong>2006</strong> reference case, the shares of these fuelschange slightly from 2004 <strong>to</strong> <strong>2030</strong>, <strong>with</strong> more coal andless petroleum and natural gas. The combined shareof carbon-neutral renewable and nuclear energy isstable from 2004 <strong>to</strong> <strong>2030</strong> at 14 percent. As a result,CO 2 emissions increase by a moderate average of 1.2percent per year over the period, slightly higher thanthe average annual increase in <strong>to</strong>tal energy use (Figure107). At the same time, the economy becomes lesscarbon intensive: the percentage increase in CO 2emissions is one-third the increase in GDP, andemissions per capita increase by only 11 percent overthe 26-year period.The fac<strong>to</strong>rs that influence growth in CO 2 emissionsare the same as those that drive increases in energydemand. Among the most significant are populationgrowth; increased penetration of computers, electronics,appliances, and office equipment; increases incommercial floorspace; growth in industrial output;increases in highway, rail, and air travel; and continuedreliance on coal and natural gas for electric powergeneration. The increases in demand for energy servicesare partially offset by efficiency improvementsand shifts <strong>to</strong>ward less energy-intensive industries.New CO 2 mitigation programs, more rapid improvementsin technology, or more rapid adoption of voluntaryprograms could result in lower CO 2 emissionslevels than projected here.TransportationElectricity generationEmissions <strong>Projections</strong> Change WithEconomic Growth AssumptionsFigure 108. Carbon dioxide emissions inthree economic growth cases, 1990-<strong>2030</strong>(million metric <strong>to</strong>ns)10,0008,0006,0004,0002,000His<strong>to</strong>ry<strong>Projections</strong>01990 2004 2010 2020 <strong>2030</strong>High growthReferenceLow growthThe high economic growth case assumes highergrowth in population, labor force, and productivitythan in the reference case, leading <strong>to</strong> higher industrialoutput, higher disposable income, lower inflation,and lower interest rates. The low economicgrowth case assumes the reverse. The spread in GDPprojections increases over time, <strong>with</strong> GDP in thealternative cases varying by about 15 percent fromthe reference case in <strong>2030</strong>.Alternative projections for industrial output, commercialfloorspace, housing, and transportation influencethe demand for energy and result in variations inCO 2 emissions (Figure 108). Emissions in <strong>2030</strong> are 10percent lower in the low growth case and 10 percenthigher in the high growth case. The strength of therelationship between economic growth and emissionsvaries by end-use sec<strong>to</strong>r. It is strongest for the industrialsec<strong>to</strong>r and, <strong>to</strong> a lesser extent, the transportationsec<strong>to</strong>r, where economic activity strongly influencesenergy use and emissions, and where fuel choices arelimited. It is weaker in the commercial and residentialsec<strong>to</strong>rs, where population and building characteristicshave large influences and vary less across thethree cases.In the electricity sec<strong>to</strong>r, changes in electricity salesacross the cases affect the amount of new, more efficientgenerating capacity required, reducing the sensitivityof energy use <strong>to</strong> GDP. However, the choice ofcoal for most new baseload capacity increases CO 2intensity in the high growth case while decreasing itin the low case, offsetting the effects of changes inefficiency across the cases.<strong>Energy</strong> Information Administration / <strong>Annual</strong> <strong>Energy</strong> <strong>Outlook</strong> <strong>2006</strong> 103


