

Annual Energy Outlook 2006 with Projections to 2030 - Usinfo.org
Annual Energy Outlook 2006 with Projections to 2030 - Usinfo.org
Annual Energy Outlook 2006 with Projections to 2030 - Usinfo.org

You also want an ePaper? Increase the reach of your titles
YUMPU automatically turns print PDFs into web optimized ePapers that Google loves.
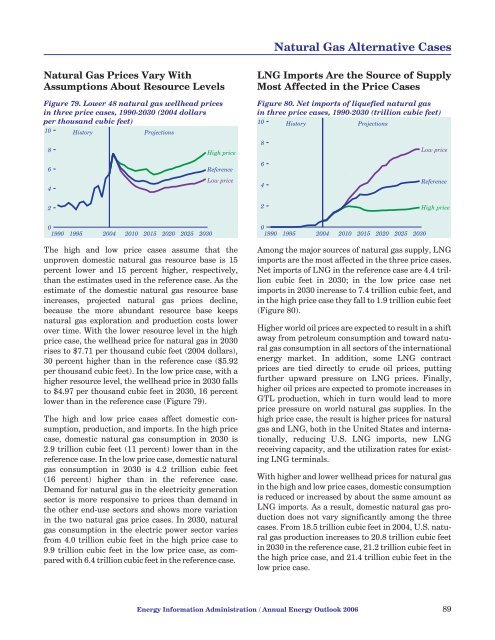
Natural Gas Alternative CasesNatural Gas Prices Vary WithAssumptions About Resource LevelsFigure 79. Lower 48 natural gas wellhead pricesin three price cases, 1990-<strong>2030</strong> (2004 dollarsper thousand cubic feet)10 His<strong>to</strong>ry<strong>Projections</strong>864High priceReferenceLow priceLNG Imports Are the Source of SupplyMost Affected in the Price CasesFigure 80. Net imports of liquefied natural gasin three price cases, 1990-<strong>2030</strong> (trillion cubic feet)10864His<strong>to</strong>ry<strong>Projections</strong>Low priceReference22High price01990 1995 2004 2010 2015 2020 2025 <strong>2030</strong>The high and low price cases assume that theunproven domestic natural gas resource base is 15percent lower and 15 percent higher, respectively,than the estimates used in the reference case. As theestimate of the domestic natural gas resource baseincreases, projected natural gas prices decline,because the more abundant resource base keepsnatural gas exploration and production costs lowerover time. With the lower resource level in the highprice case, the wellhead price for natural gas in <strong>2030</strong>rises <strong>to</strong> $7.71 per thousand cubic feet (2004 dollars),30 percent higher than in the reference case ($5.92per thousand cubic feet). In the low price case, <strong>with</strong> ahigher resource level, the wellhead price in <strong>2030</strong> falls<strong>to</strong> $4.97 per thousand cubic feet in <strong>2030</strong>, 16 percentlower than in the reference case (Figure 79).The high and low price cases affect domestic consumption,production, and imports. In the high pricecase, domestic natural gas consumption in <strong>2030</strong> is2.9 trillion cubic feet (11 percent) lower than in thereference case. In the low price case, domestic naturalgas consumption in <strong>2030</strong> is 4.2 trillion cubic feet(16 percent) higher than in the reference case.Demand for natural gas in the electricity generationsec<strong>to</strong>r is more responsive <strong>to</strong> prices than demand inthe other end-use sec<strong>to</strong>rs and shows more variationin the two natural gas price cases. In <strong>2030</strong>, naturalgas consumption in the electric power sec<strong>to</strong>r variesfrom 4.0 trillion cubic feet in the high price case <strong>to</strong>9.9 trillion cubic feet in the low price case, as compared<strong>with</strong> 6.4 trillion cubic feet in the reference case.01990 1995 2004 2010 2015 2020 2025 <strong>2030</strong>Among the major sources of natural gas supply, LNGimports are the most affected in the three price cases.Net imports of LNG in the reference case are 4.4 trillioncubic feet in <strong>2030</strong>; in the low price case netimports in <strong>2030</strong> increase <strong>to</strong> 7.4 trillion cubic feet, andin the high price case they fall <strong>to</strong> 1.9 trillion cubic feet(Figure 80).Higher world oil prices are expected <strong>to</strong> result in a shiftaway from petroleum consumption and <strong>to</strong>ward naturalgas consumption in all sec<strong>to</strong>rs of the internationalenergy market. In addition, some LNG contractprices are tied directly <strong>to</strong> crude oil prices, puttingfurther upward pressure on LNG prices. Finally,higher oil prices are expected <strong>to</strong> promote increases inGTL production, which in turn would lead <strong>to</strong> moreprice pressure on world natural gas supplies. In thehigh price case, the result is higher prices for naturalgas and LNG, both in the United States and internationally,reducing U.S. LNG imports, new LNGreceiving capacity, and the utilization rates for existingLNG terminals.With higher and lower wellhead prices for natural gasin the high and low price cases, domestic consumptionis reduced or increased by about the same amount asLNG imports. As a result, domestic natural gas productiondoes not vary significantly among the threecases. From 18.5 trillion cubic feet in 2004, U.S. naturalgas production increases <strong>to</strong> 20.8 trillion cubic feetin <strong>2030</strong> in the reference case, 21.2 trillion cubic feet inthe high price case, and 21.4 trillion cubic feet in thelow price case.<strong>Energy</strong> Information Administration / <strong>Annual</strong> <strong>Energy</strong> <strong>Outlook</strong> <strong>2006</strong> 89


